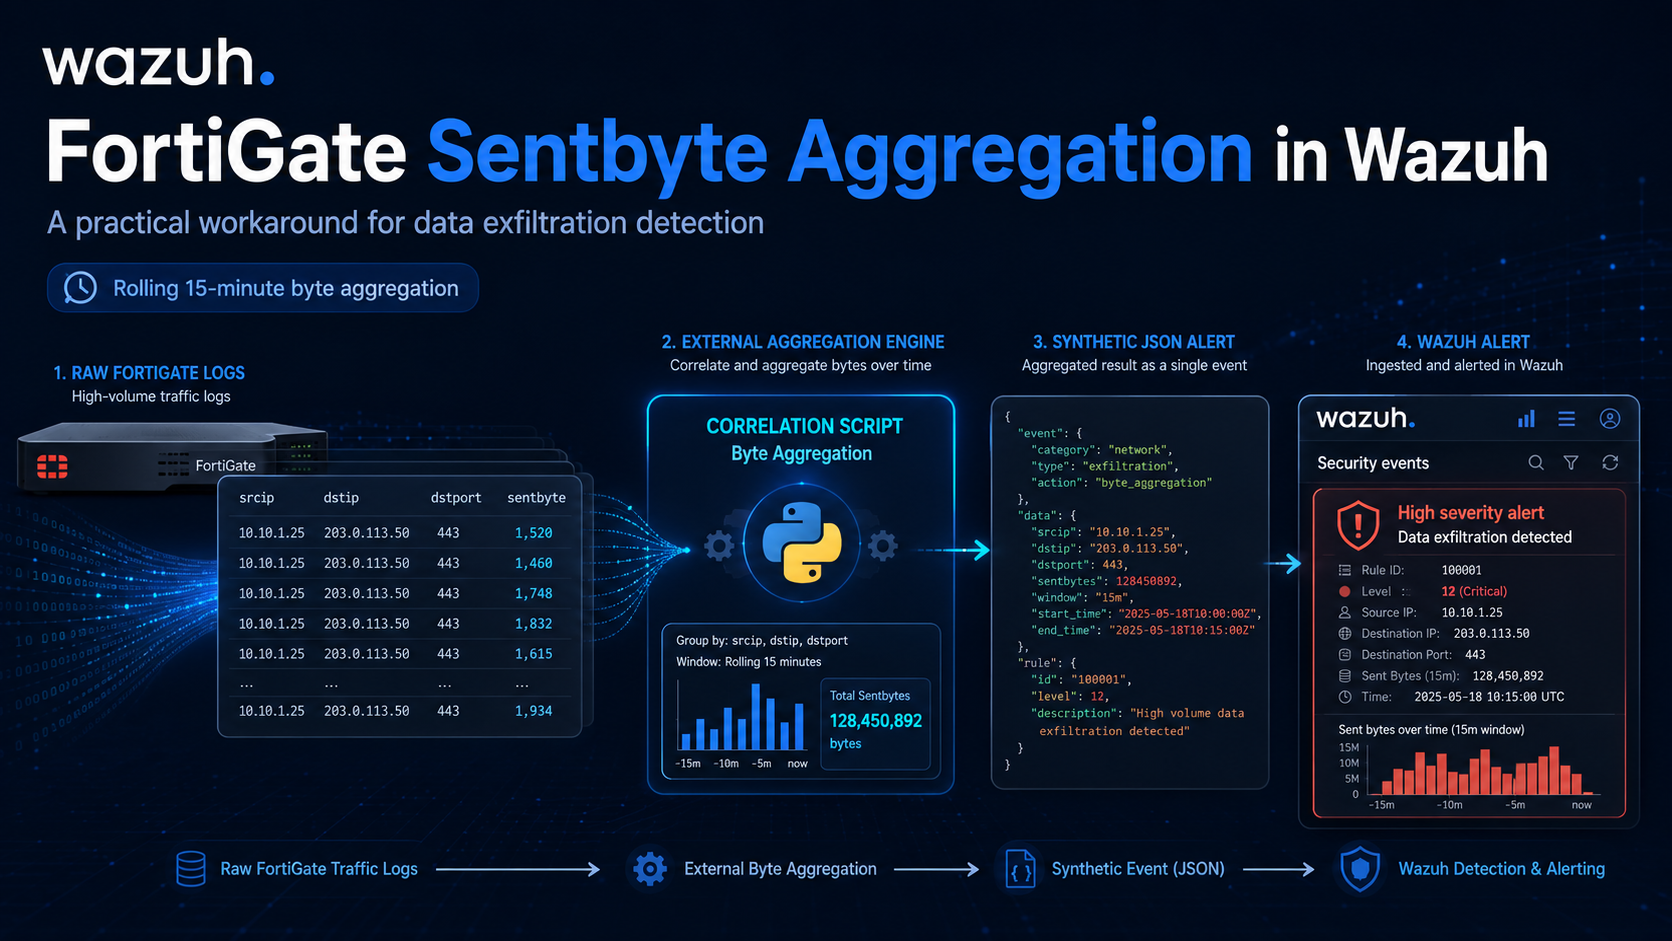
FortiGate Sentbyte Aggregation in Wazuh: A Practical Workaround for Data Exfiltration Detection
A step-by-step tutorial for ingesting raw FortiGate traffic logs, generating synthetic exfiltration alerts, and keeping Wazuh as the official detection source.
Why this tutorial matters
Wazuh can parse FortiGate traffic logs very well, but it is not designed to do rolling byte aggregation like:
- SUM(sentbyte) by srcip + dstip + dst_port within 15 minutes
That means if you want to detect potential data exfiltration based on large outbound transfer volume, the clean design is:
FortiGate raw logs
  -> Wazuh collects normal traffic events
  -> local correlation service sums sentbyte
  -> correlation service writes a synthetic JSON log
  -> Wazuh reads the synthetic log
  -> Wazuh custom rule creates the final official alert
  -> AlistoIR or another SOAR receives the correlated alert
The most important rule is this:
Never write directly to /var/ossec/logs/alerts/alerts.json.
Your correlation service should write to its own log file, then let Wazuh generate the official alert.
What you will build
This tutorial creates two useful alert layers:
- A raw FortiGate investigation alert in Wazuh for the original traffic event.
- A final synthetic exfiltration alert in Wazuh when outbound bytes cross a threshold within a rolling 15-minute window.
Final architecture
FortiGate
  -> /var/log/fortigate.log
  -> Wazuh localfile
  -> built-in FortiGate decoder
  -> custom raw rule 110520

/var/log/fortigate.log
  -> byte-correlation.py
  -> /var/log/wazuh-correlation/data_exfil.json
  -> Wazuh localfile
  -> custom correlation rule 110510
  -> /var/ossec/logs/alerts/alerts.json
  -> AlistoIR or another downstream integration
Why is this design better
- Wazuh stays the official detection source.
- Analysts still get the raw FortiGate alert for investigation.
- The correlation logic stays separate and is easier to maintain.
- The final synthetic alert is still searchable, rule-based, and auditable inside Wazuh.
Tested lab context
This tutorial is based on a working lab flow with:
- Wazuh 4.14.5 rc1
- built-in FortiGate decoder and ruleset
- custom raw FortiGate rule 110520
- custom final correlation rule 110510
If your environment already uses those IDs, choose another unused range.
Prerequisites
You need:
- a running Wazuh manager
- FortiGate traffic logs sent through syslog
- access to the Linux server that receives FortiGate logs
- Python 3 on the server that will run the correlator
- permission to edit ossec.conf and Wazuh custom rule files
Step 1: Decide where the FortiGate logs will land
You have two valid deployment patterns.
Option A: Manager-local pattern
FortiGate sends syslog directly to the Wazuh manager.
FortiGate -> Wazuh manager -> /var/log/fortigate.logThis is the simplest version.
Option B: Separate Linux collector pattern
FortiGate sends syslog to another Linux server, which has a Wazuh agent.
FortiGate
  -> Linux collector
  -> /var/log/fortigate.log
  -> byte-correlation.py
  -> /var/log/wazuh-correlation/data_exfil.json
  -> Wazuh agent
  -> Wazuh manager
If you use a separate collector, the correlator should usually run on that collector rather than on the manager.
Step 2: Configure FortiGate syslog landing
If you are using rsyslog, create a dedicated FortiGate landing file.
File:
nano /etc/rsyslog.d/40-fortigate.confExample:
# FortiGate syslog landing file for the Wazuh manager or collector
#
# Adjust the port and transport if your FortiGate sends TCP or a different port.

module(load="imudp")
input(type="imudp" port="514")

if ($fromhost-ip == "FORTIGATE_IP_HERE") then {
    action(type="omfile" file="/var/log/fortigate.log")
    stop
}
Replace FORTIGATEIPHERE with the real FortiGate source IP.
Then create the file and restart rsyslog:
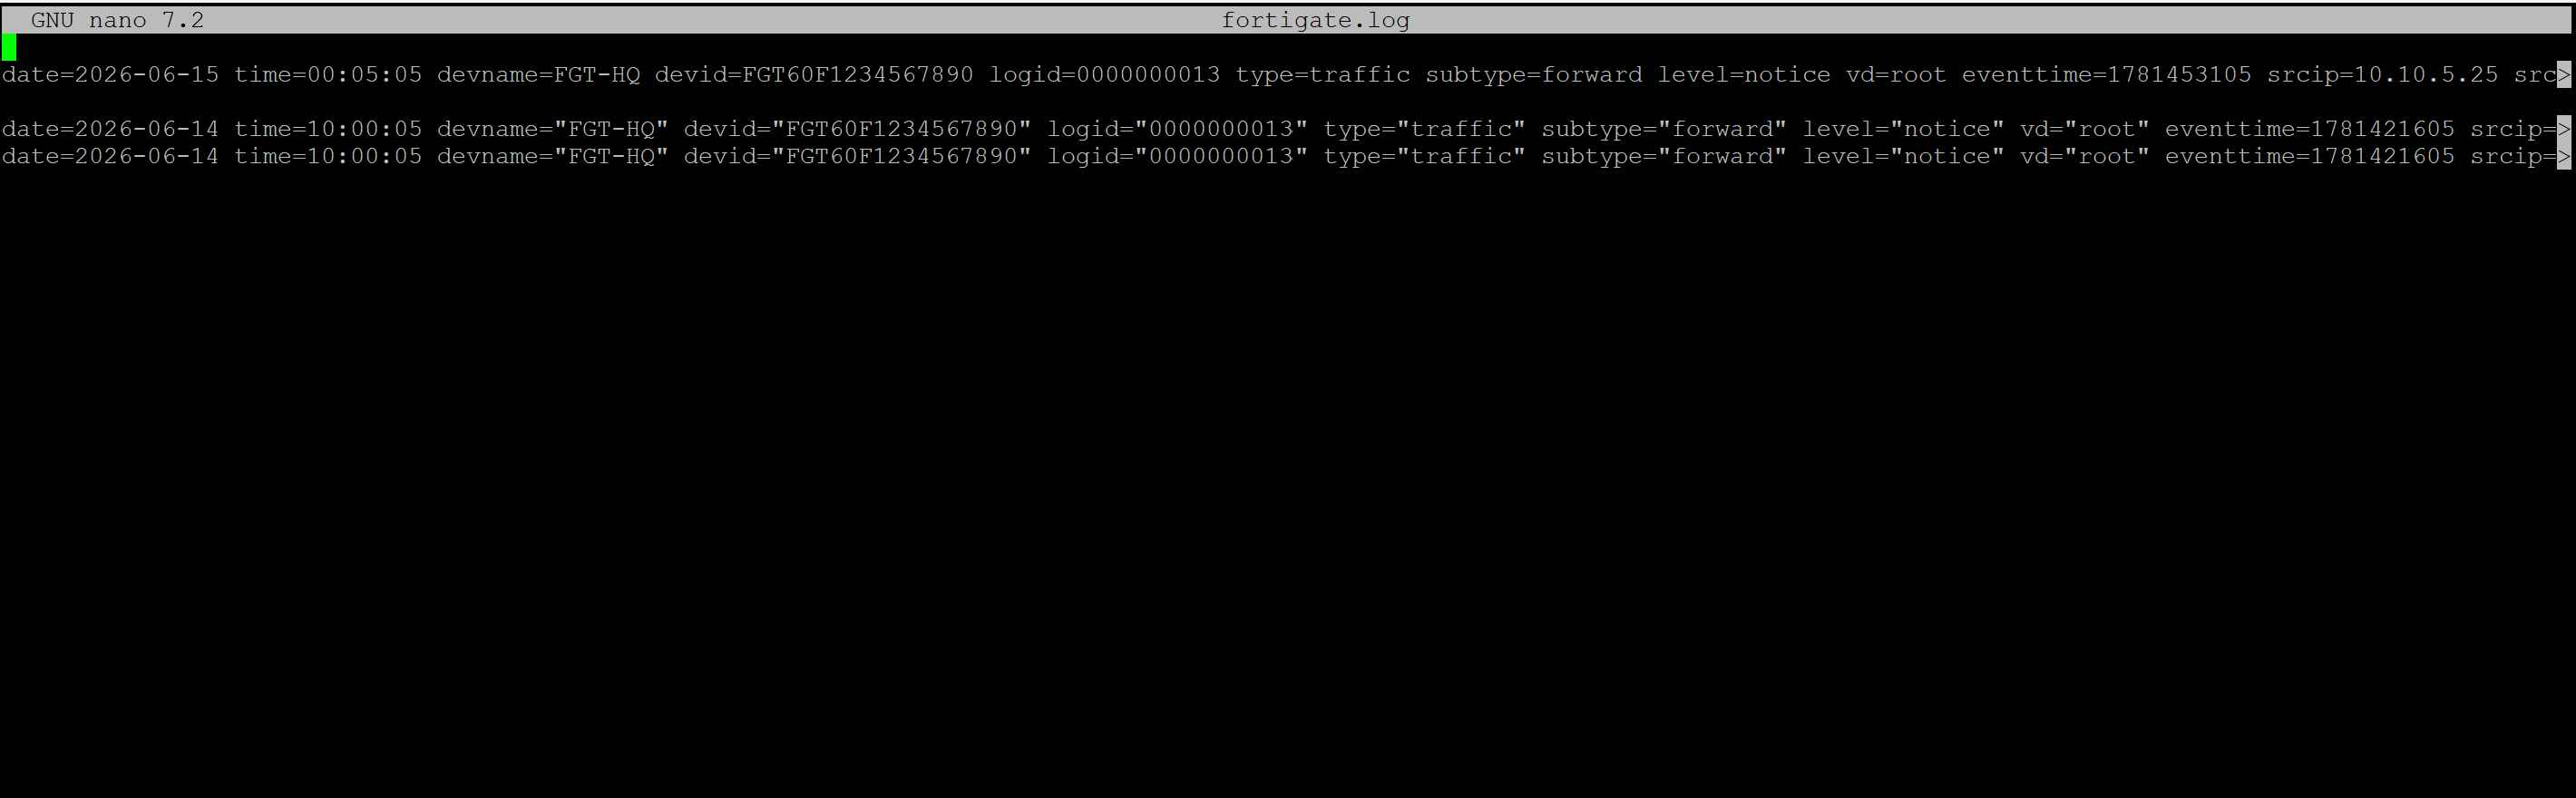
sudo touch /var/log/fortigate.log
sudo systemctl restart rsyslog
sudo tail -f /var/log/fortigate.log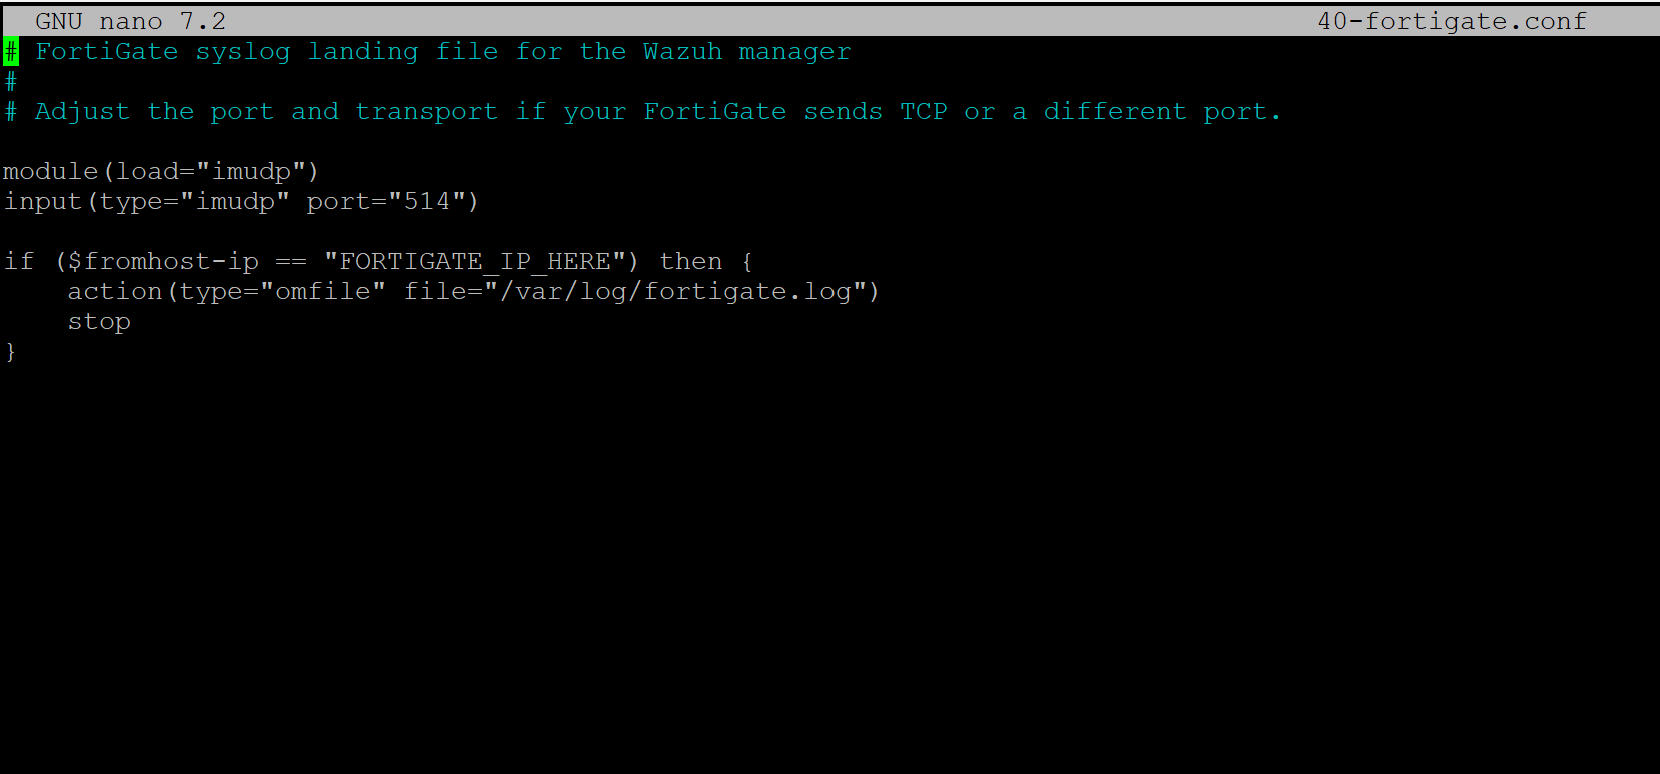
If logs are arriving correctly, you should now see raw FortiGate traffic events in /var/log/fortigate.log.
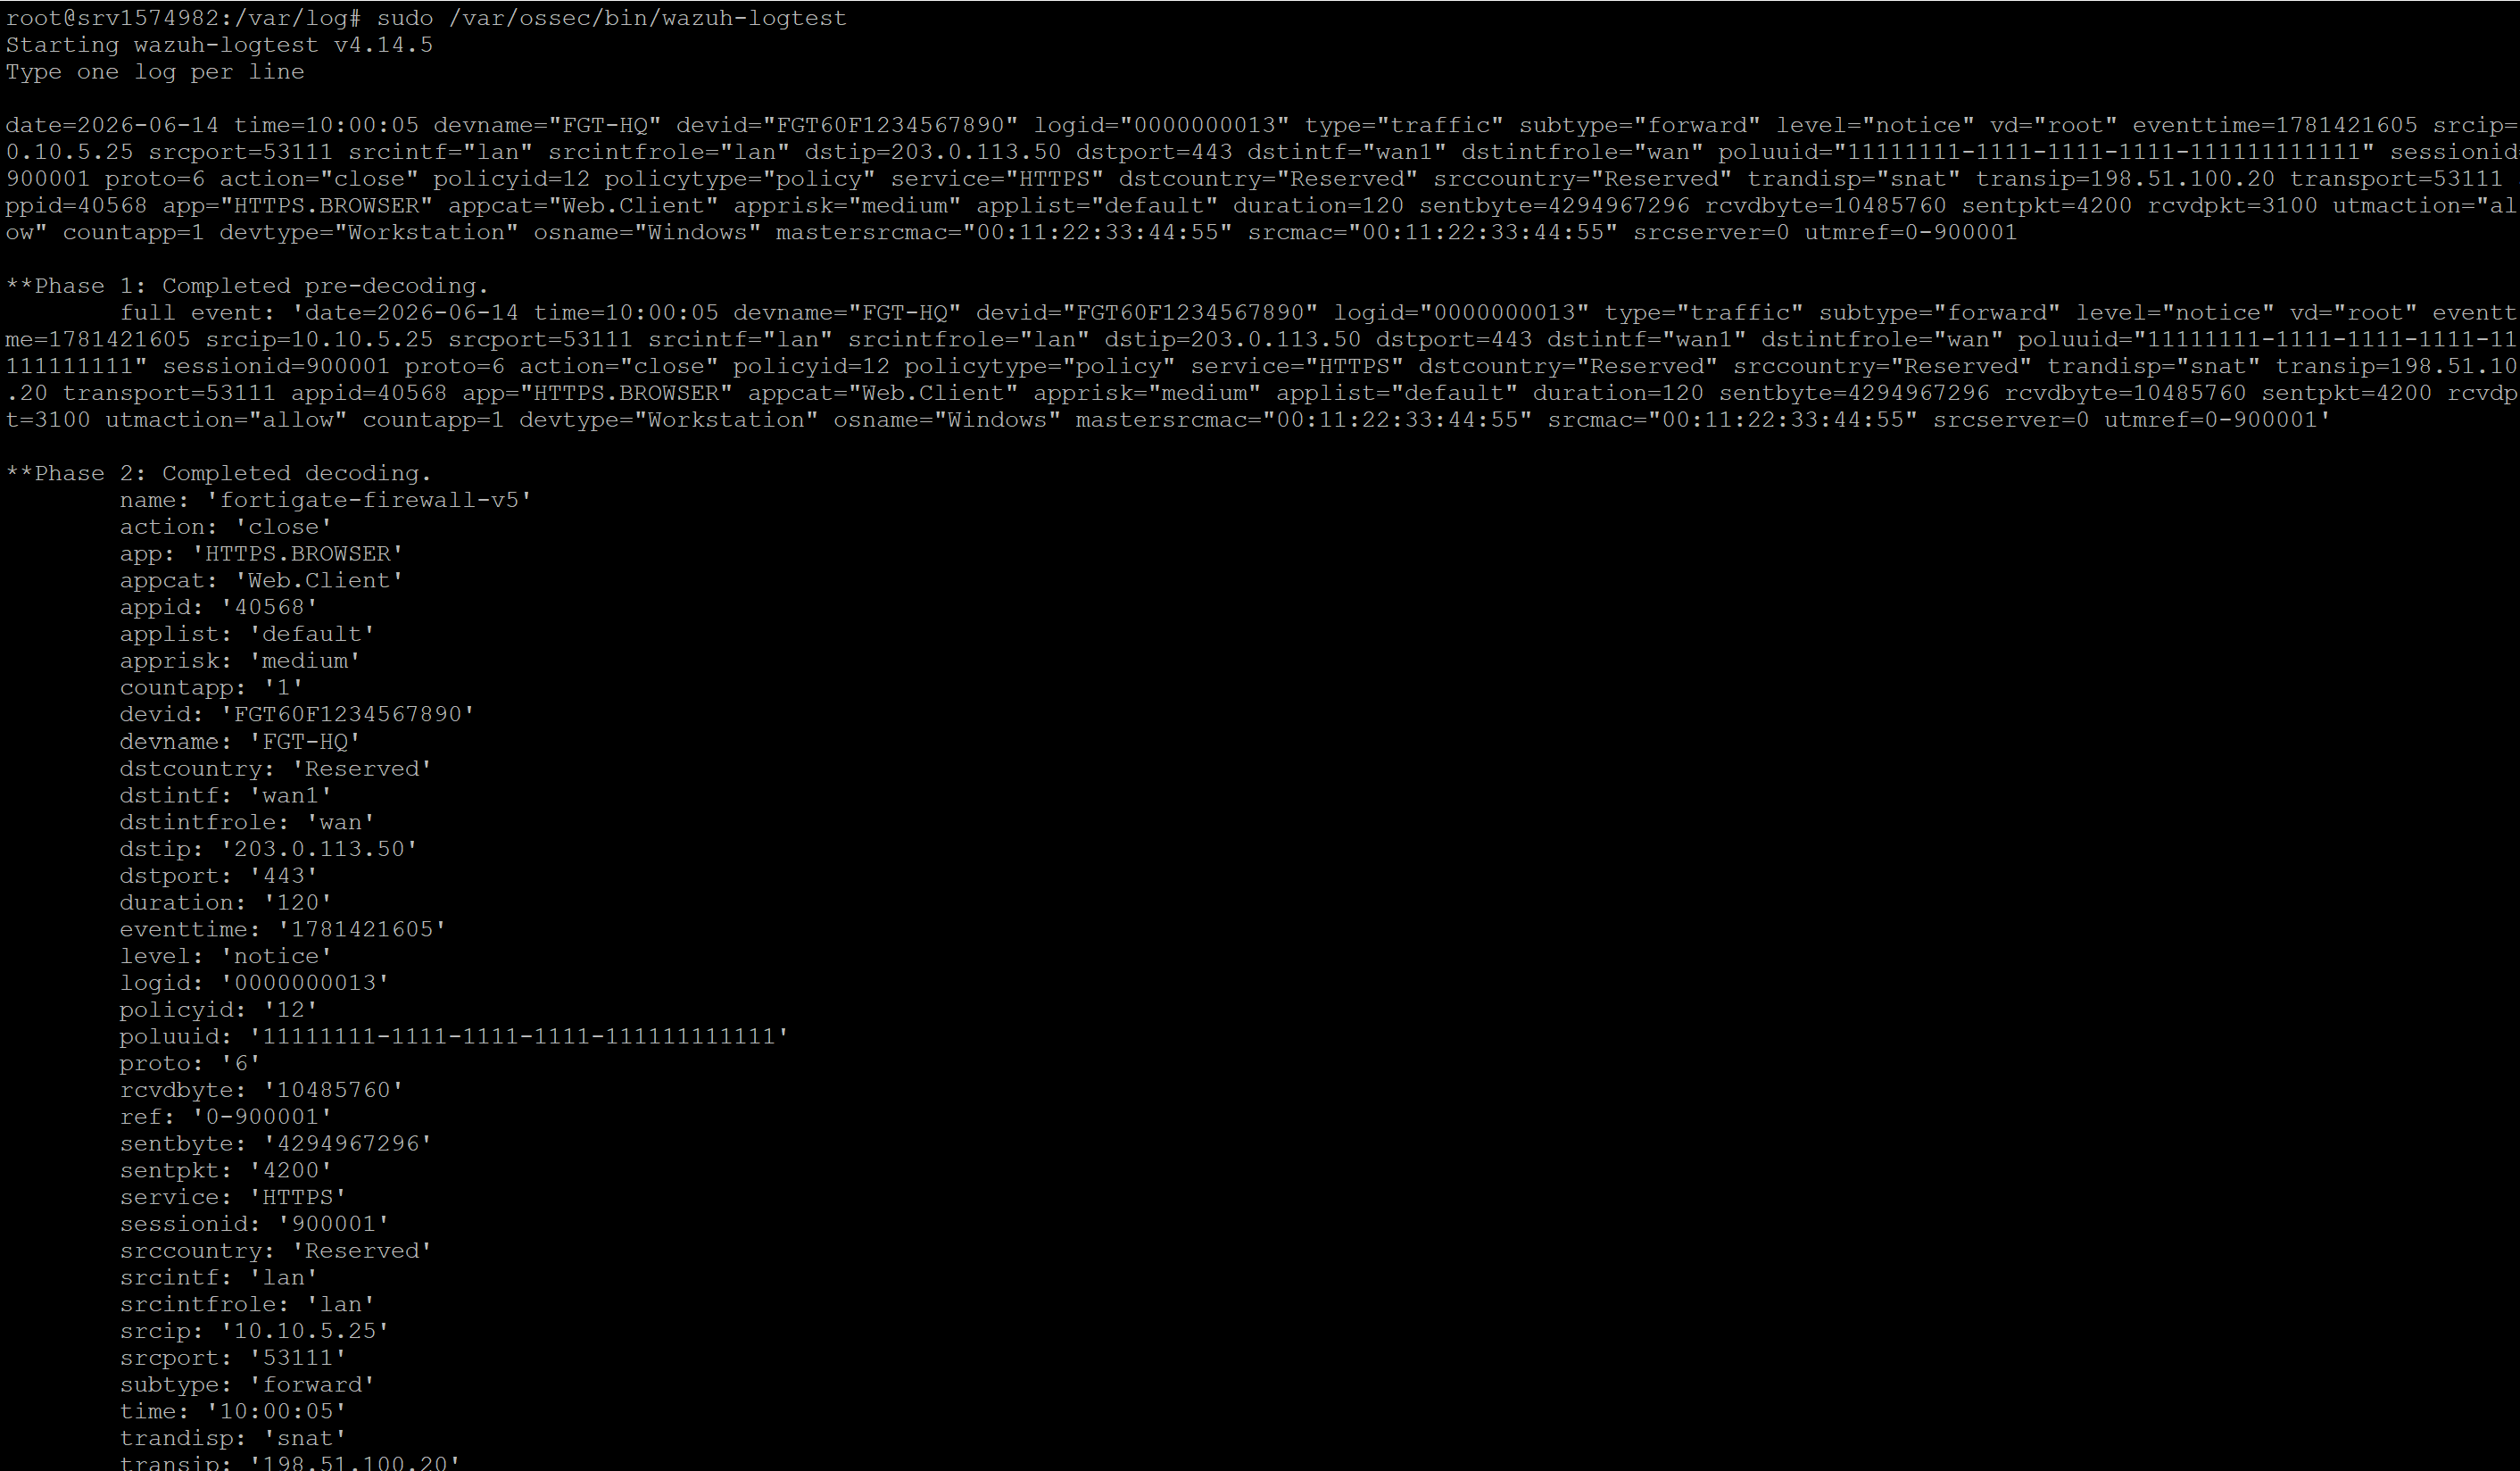
Step 3: Validate the built-in FortiGate decoder
Before adding correlation, confirm Wazuh can parse a FortiGate traffic event correctly.
Run:
sudo /var/ossec/bin/wazuh-logtestPaste this sample FortiGate traffic line:
date=2026-06-14 time=10:00:05 devname="FGT-HQ" devid="FGT60F1234567890" logid="0000000013" type="traffic" subtype="forward" level="notice" vd="root" eventtime=1781421605 srcip=10.10.5.25 srcport=53111 srcintf="lan" srcintfrole="lan" dstip=203.0.113.50 dstport=443 dstintf="wan1" dstintfrole="wan" poluuid="11111111-1111-1111-1111-111111111111" sessionid=900001 proto=6 action="close" policyid=12 policytype="policy" service="HTTPS" dstcountry="Reserved" srccountry="Reserved" trandisp="snat" transip=198.51.100.20 transport=53111 appid=40568 app="HTTPS.BROWSER" appcat="Web.Client" apprisk="medium" applist="default" duration=120 sentbyte=4294967296 rcvdbyte=10485760 sentpkt=4200 rcvdpkt=3100 utmaction="allow" countapp=1 devtype="Workstation" osname="Windows" mastersrcmac="00:11:22:33:44:55" srcmac="00:11:22:33:44:55" srcserver=0 utmref=0-900001You should see FortiGate fields like:
- srcip
- dstip
- dstport
- sessionid
- sentbyte
And Wazuh should match the built-in FortiGate traffic rule chain.
Step 4: Create the raw FortiGate investigation rule
This rule is not your final exfiltration detection. Its purpose is to make the original FortiGate traffic event visible in alerts.json for investigation.
Create:
sudo nano /var/ossec/etc/rules/fortigate_raw_traffic_rules.xmlAdd:
<group name="fortigate,custom,raw_traffic,">
  <rule id="110520" level="3">
    <if_sid>81618</if_sid>
    <description>FortiGate raw traffic event with outbound byte count recorded</description>
    <group>fortigate,network,raw_traffic,custom_rule,investigation_ready,</group>
  </rule>
</group>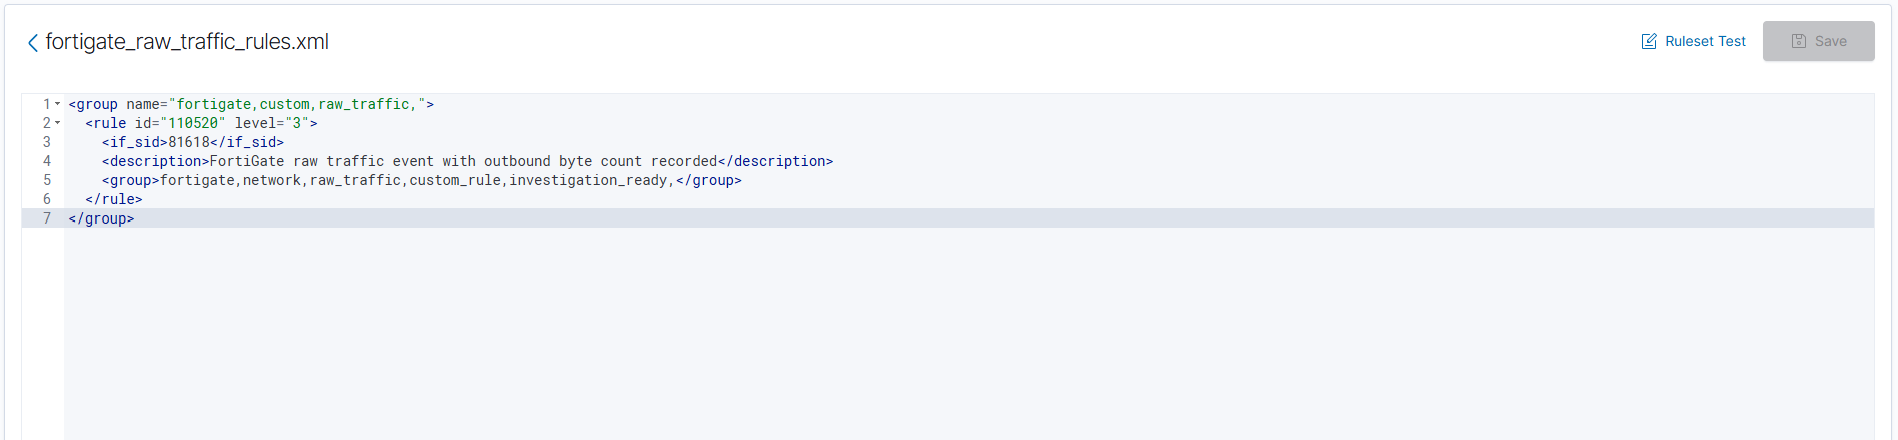
Why rule 81618?
81618 is Wazuh’s built-in FortiGate traffic rule. Your custom rule uses it as the parent, so the raw FortiGate event becomes easier to investigate in alerts.json.
Step 5: Register the raw FortiGate log with Wazuh
If the raw log is on the Wazuh manager
Add this to the manager’s /var/ossec/etc/ossec.conf:
<localfile>
  <log_format>syslog</log_format>
  <location>/var/log/fortigate.log</location>
</localfile>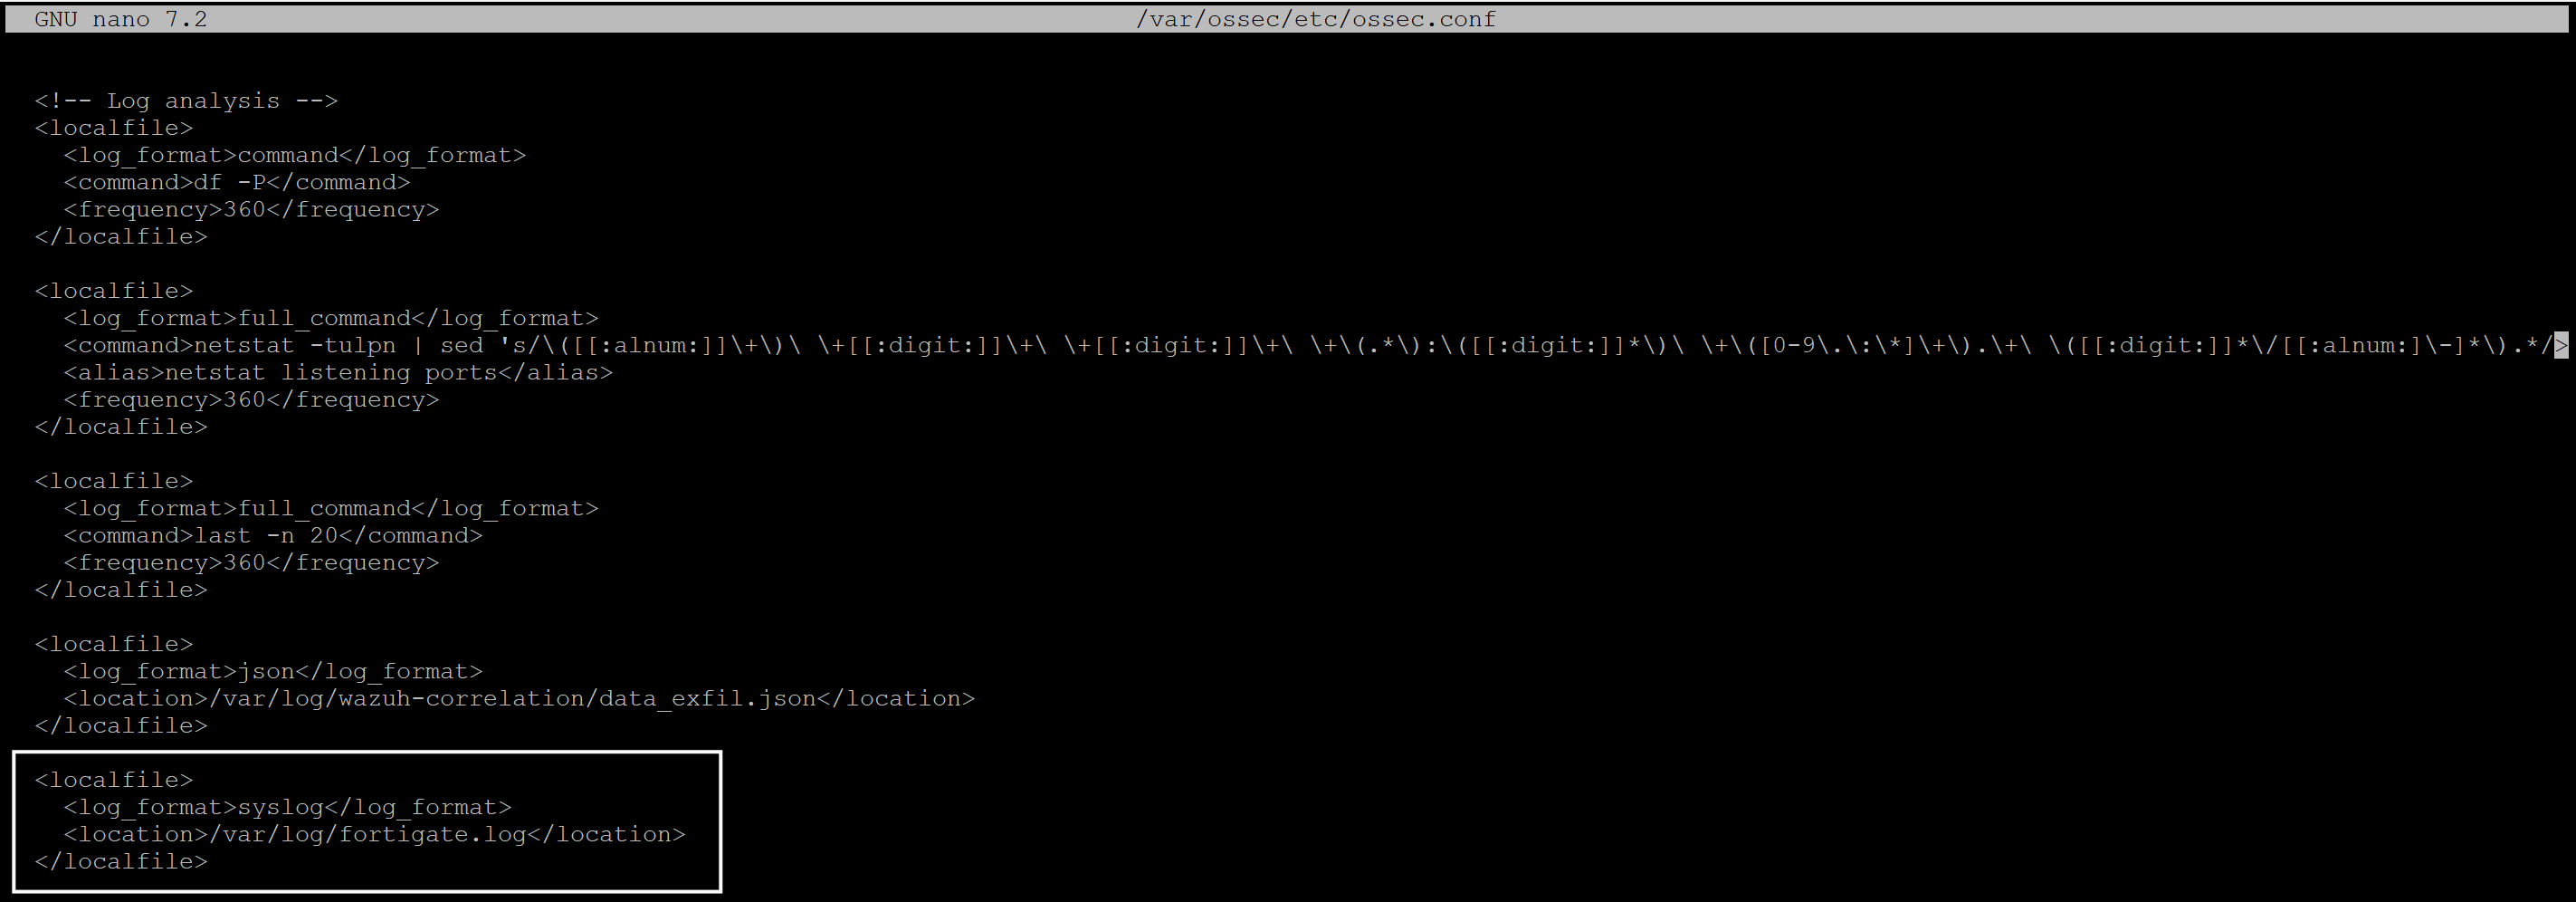
If the raw log is on a separate Linux collector with a Wazuh agent
Add the same block to the agent’s /var/ossec/etc/ossec.conf instead.
Step 6: Create the synthetic correlation output path
Create the directories and file:
sudo mkdir -p /opt/wazuh-correlation
sudo mkdir -p /var/log/wazuh-correlation
sudo mkdir -p /var/lib/wazuh-correlation
sudo touch /var/log/wazuh-correlation/data_exfil.json
sudo chown root:wazuh /var/log/wazuh-correlation/data_exfil.json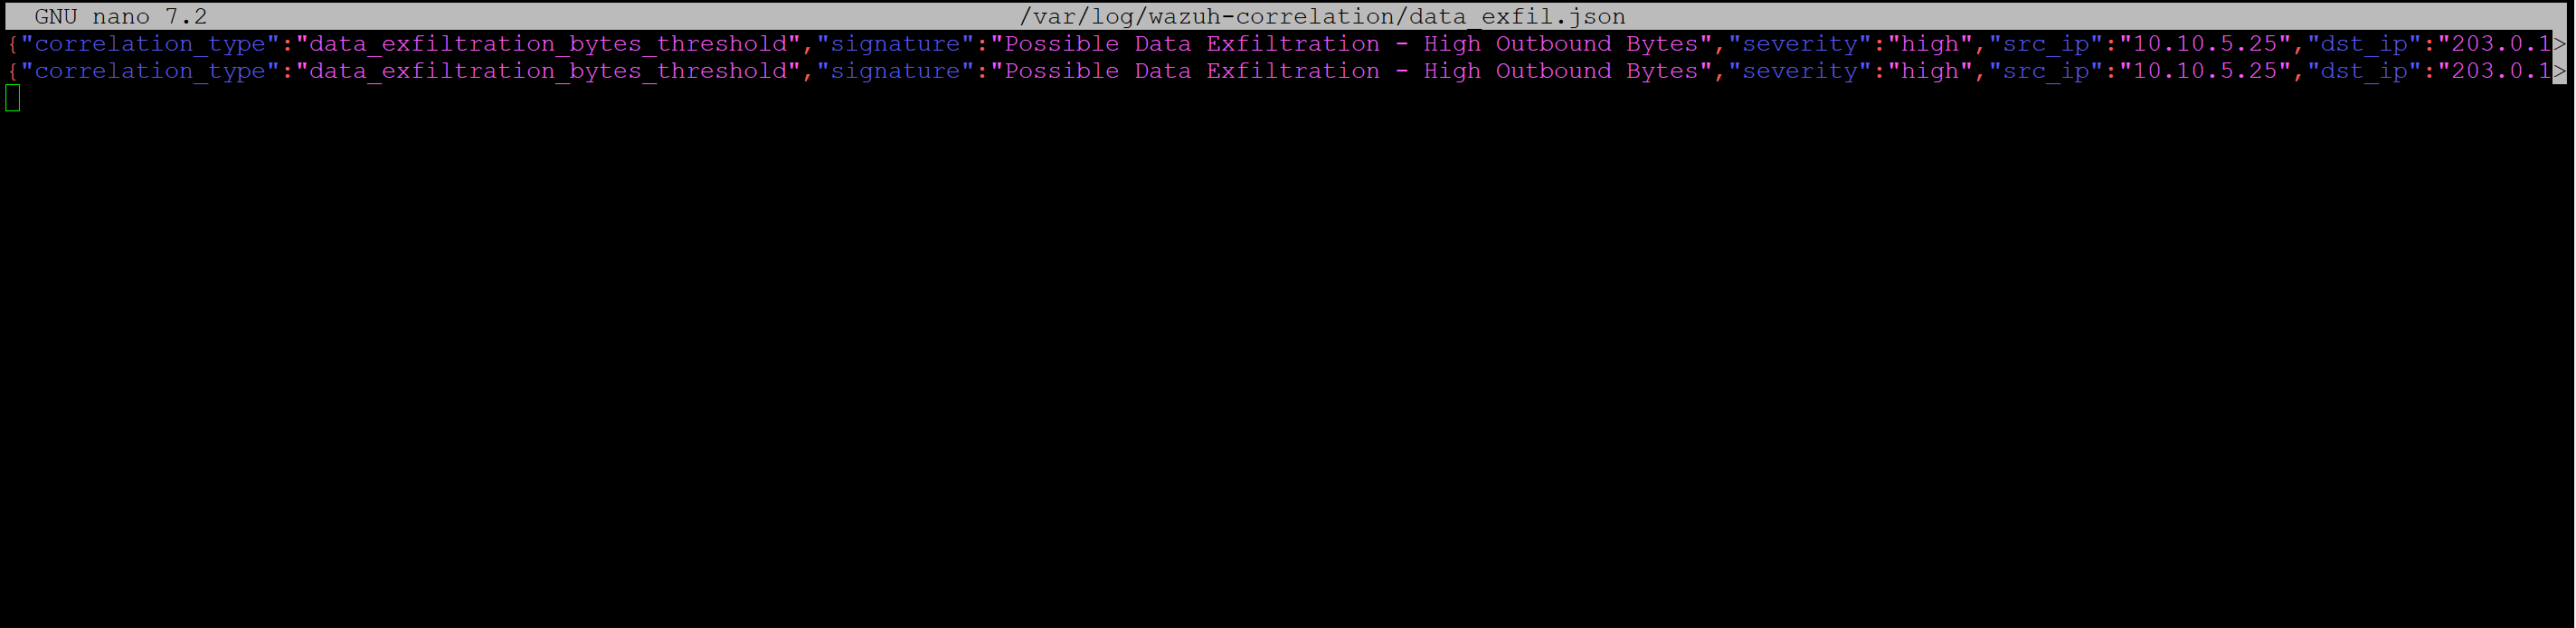
This file will receive the synthetic JSON alerts produced by your correlation script.
Step 7: Create the final correlation rule
Now create the Wazuh rule that will detect the synthetic JSON alert.
Create:
sudo nano /var/ossec/etc/rules/data_exfil_correlation_rules.xmlAdd:
<group name="firewall,correlation,data_exfiltration,">
  <rule id="110510" level="12">
    <decoded_as>json</decoded_as>
    <field name="correlation_type">^data_exfiltration_bytes_threshold$</field>
    <description>Possible Data Exfiltration: Suspiciously large outbound data transfer detected within 15 minutes</description>
    <group>data_exfiltration,network,correlation,</group>
    <mitre>
      <id>T1041</id>
      <id>T1048</id>
      <id>T1020</id>
    </mitre>
  </rule>
</group>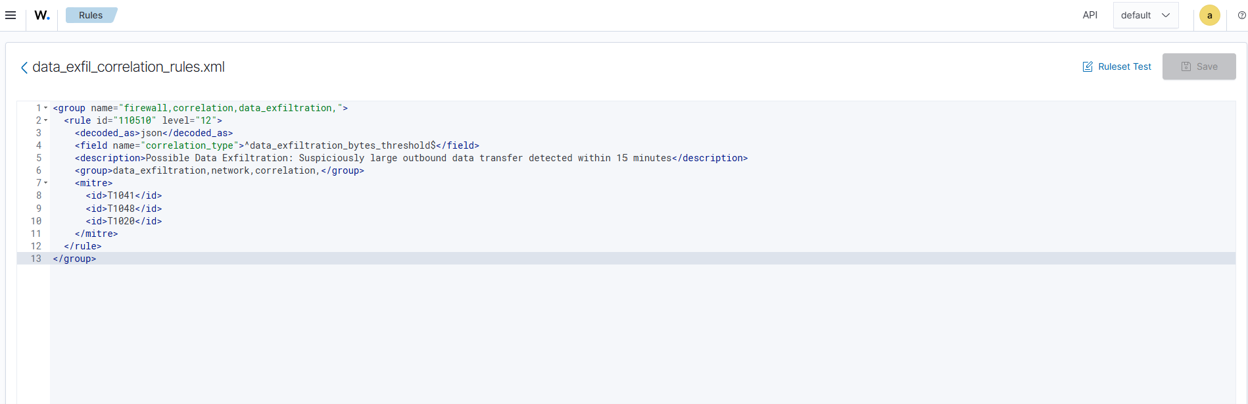
This rule looks for:
correlation_type = data_exfiltration_bytes_thresholdand creates the final high-severity exfiltration alert.
Step 8: Register the synthetic JSON log with Wazuh
If the synthetic file is on the Wazuh manager
Add this to the manager’s /var/ossec/etc/ossec.conf:
<localfile>
  <log_format>json</log_format>
  <location>/var/log/wazuh-correlation/data_exfil.json</location>
</localfile>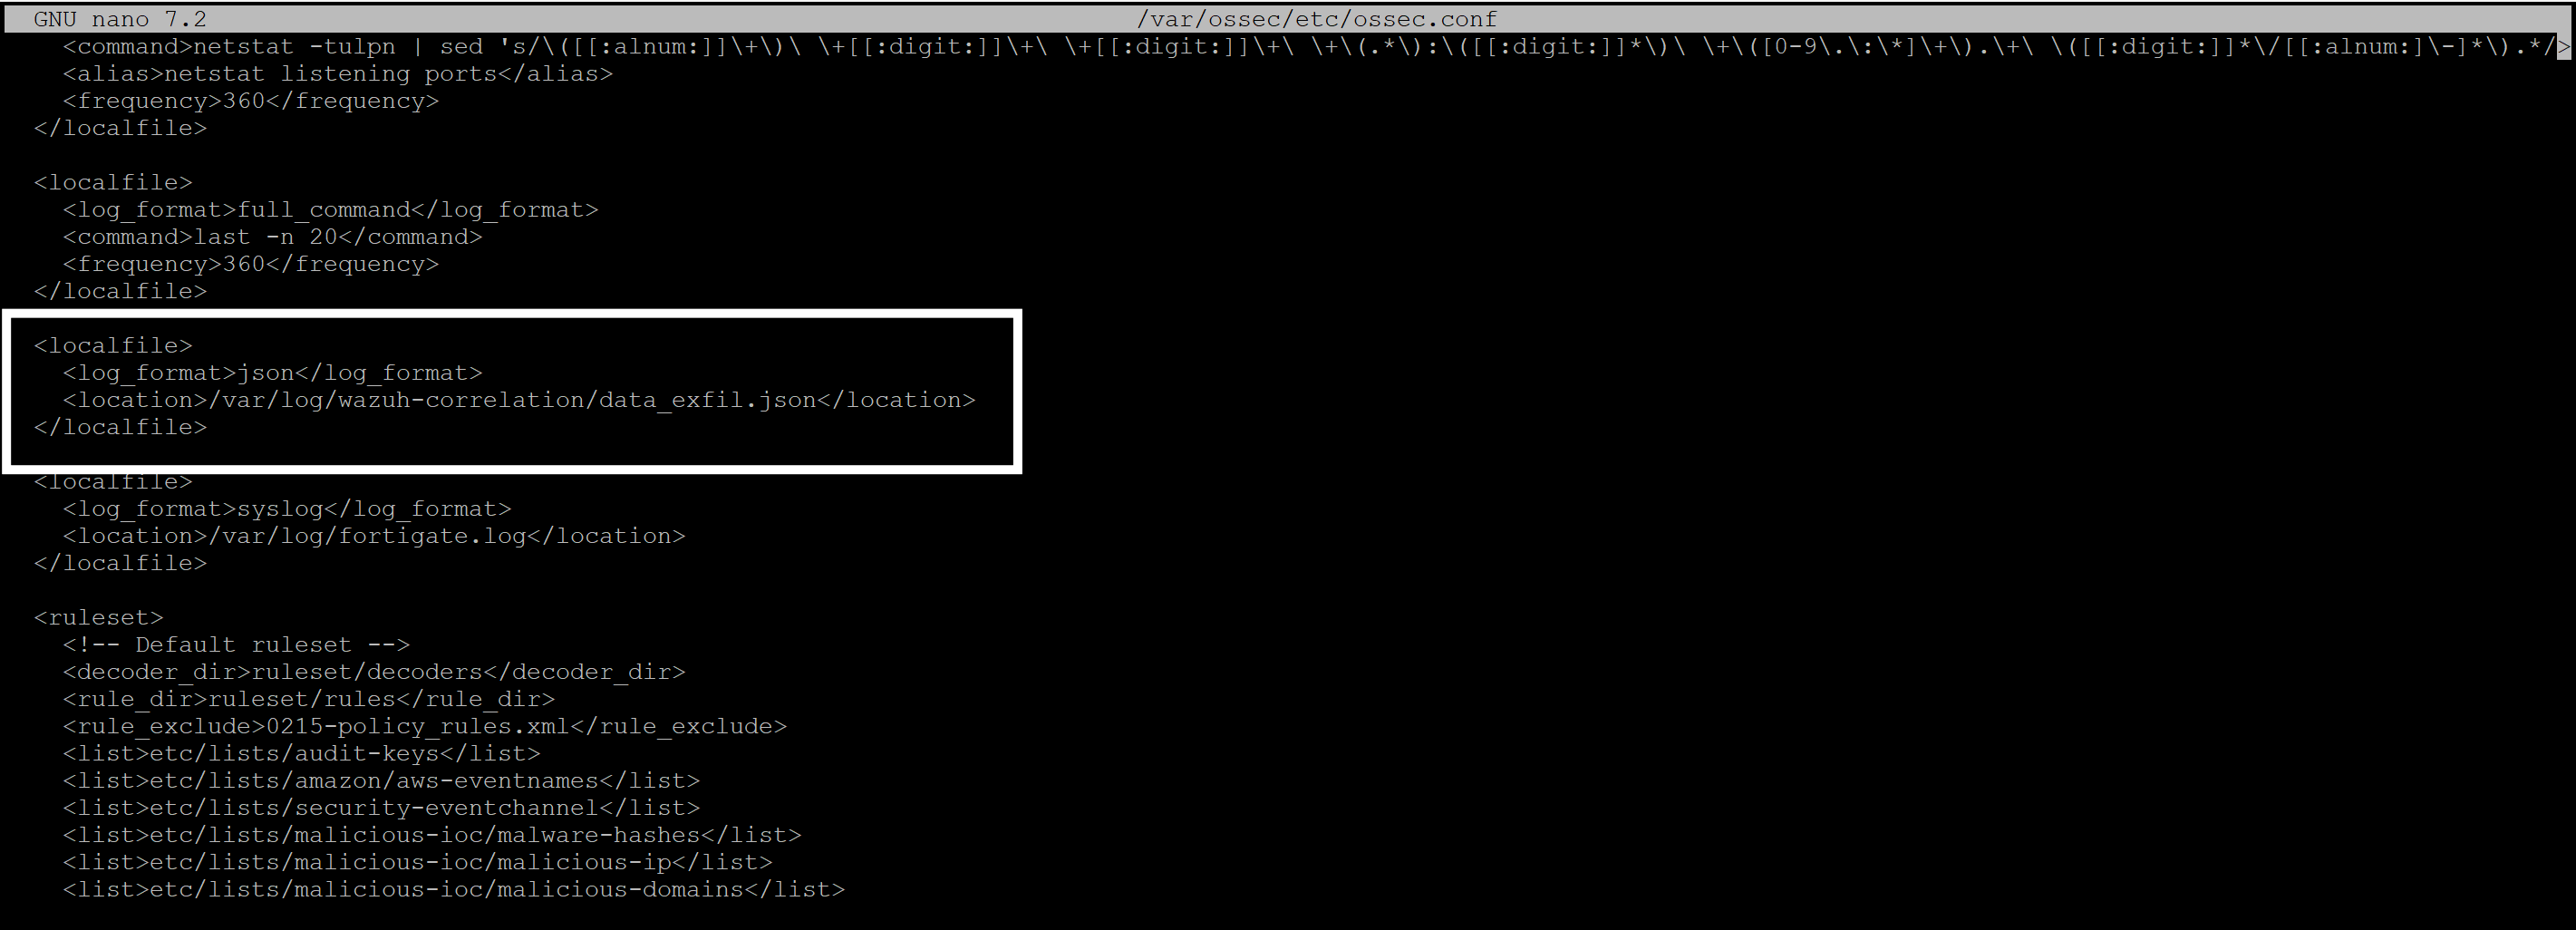
If the synthetic file is on a separate Linux collector with a Wazuh agent
Add the same block to the agent’s ossec.conf.
Step 9: Create byte-correlation.py
Save this as:
/opt/wazuh-correlation/byte-correlation.pyThis script:
- reads FortiGate raw logs
- keeps only type=traffic and subtype=forward
- parses sentbyte
- groups by srcip + dstip + dst_port + protocol
- sums outbound bytes inside a rolling 15-minute window
- writes a synthetic JSON alert once the threshold is reached
#!/usr/bin/env python3
"""Aggregate FortiGate sentbyte values into synthetic Wazuh JSON alerts."""

from __future__ import annotations

import argparse
import json
import os
import shlex
import sys
import time
from collections import defaultdict, deque
from dataclasses import dataclass
from datetime import UTC, datetime, timedelta
from pathlib import Path
from typing import Deque, Iterable


@dataclass
class Event:
    timestamp: datetime
    src_ip: str
    dst_ip: str
    dst_port: str
    protocol: str
    session_id: str
    sentbyte: int
    raw_fields: dict[str, str]


@dataclass
class ReadState:
    inode: int = 0
    offset: int = 0
    initialized: bool = False


class Correlator:
    def __init__(self, threshold_bytes: int, window_minutes: int) -> None:
        self.threshold_bytes = threshold_bytes
        self.window_minutes = window_minutes
        self.window = timedelta(minutes=window_minutes)
        self.grouped: dict[tuple[str, str, str, str], Deque[Event]] = defaultdict(deque)
        self.last_emitted_at: dict[tuple[str, str, str, str], datetime] = {}

    def process_event(self, event: Event) -> dict[str, object] | None:
        key = (event.src_ip, event.dst_ip, event.dst_port, event.protocol)
        bucket = self.grouped[key]
        bucket.append(event)

        cutoff = event.timestamp - self.window
        while bucket and bucket[0].timestamp < cutoff:
            bucket.popleft()

        total_bytes = sum(item.sentbyte for item in bucket)
        last_emitted = self.last_emitted_at.get(key)
        if total_bytes < self.threshold_bytes:
            return None
        if last_emitted and (event.timestamp - last_emitted) < self.window:
            return None

        alert = build_alert(bucket, self.window_minutes)
        self.last_emitted_at[key] = event.timestamp
        return alert


def parse_args() -> argparse.Namespace:
    parser = argparse.ArgumentParser(
        description="Read FortiGate raw logs and emit synthetic JSON correlation alerts."
    )
    parser.add_argument("--input", required=True, help="Path to raw FortiGate log file")
    parser.add_argument("--output", required=True, help="Path to write synthetic JSONL alerts")
    parser.add_argument(
        "--mode",
        choices=("once", "follow"),
        default="once",
        help="Run once over the whole file or follow the input like a service",
    )
    parser.add_argument(
        "--threshold-bytes",
        type=int,
        default=12 * 1024 * 1024 * 1024,
        help="Minimum total sent bytes within the time window before emitting an alert",
    )
    parser.add_argument(
        "--window-minutes",
        type=int,
        default=15,
        help="Rolling aggregation window in minutes",
    )
    parser.add_argument(
        "--poll-interval",
        type=float,
        default=2.0,
        help="Seconds to wait between file polls in follow mode",
    )
    parser.add_argument(
        "--state-file",
        default="",
        help="JSON file that stores read offset for follow mode",
    )
    parser.add_argument(
        "--start-at-end-on-first-run",
        action="store_true",
        help="When no prior state exists, start from EOF instead of replaying the whole file",
    )
    parser.add_argument(
        "--max-loops",
        type=int,
        default=0,
        help="Test-only guard for follow mode. Zero means run forever",
    )
    return parser.parse_args()


def parse_kv_log(line: str) -> dict[str, str]:
    fields: dict[str, str] = {}
    for token in shlex.split(line.strip()):
        if "=" not in token:
            continue
        key, value = token.split("=", 1)
        fields[key] = value.strip('"')
    return fields


def parse_timestamp(fields: dict[str, str]) -> datetime:
    date_value = fields.get("date")
    time_value = fields.get("time")
    if not date_value or not time_value:
        raise ValueError("Missing date/time fields")

    parsed = datetime.strptime(f"{date_value} {time_value}", "%Y-%m-%d %H:%M:%S")
    return parsed.replace(tzinfo=UTC)


def normalize_protocol(value: str) -> str:
    mapping = {
        "6": "TCP",
        "17": "UDP",
        "1": "ICMP",
    }
    return mapping.get(value, value.upper() if value else "UNKNOWN")


def parse_event(line: str) -> Event | None:
    fields = parse_kv_log(line)
    if fields.get("type") != "traffic" or fields.get("subtype") != "forward":
        return None

    if "sentbyte" not in fields or "srcip" not in fields or "dstip" not in fields:
        return None

    timestamp = parse_timestamp(fields)
    return Event(
        timestamp=timestamp,
        src_ip=fields["srcip"],
        dst_ip=fields["dstip"],
        dst_port=fields.get("dstport", ""),
        protocol=normalize_protocol(fields.get("proto", "")),
        session_id=fields.get("sessionid", ""),
        sentbyte=int(fields["sentbyte"]),
        raw_fields=fields,
    )


def load_events(path: Path) -> list[Event]:
    events: list[Event] = []
    for raw_line in path.read_text(encoding="utf-8").splitlines():
        line = raw_line.strip()
        if not line or line.startswith("#"):
            continue
        try:
            event = parse_event(line)
        except Exception as exc:  # pragma: no cover
            print(f"Skipping unparsable line: {exc}", file=sys.stderr)
            continue
        if event is not None:
            events.append(event)
    return sorted(events, key=lambda item: item.timestamp)


def build_alert(window_events: Iterable[Event], window_minutes: int) -> dict[str, object]:
    batch = list(window_events)
    first = batch[0]
    last = batch[-1]
    total_bytes = sum(item.sentbyte for item in batch)

    return {
        "correlation_type": "data_exfiltration_bytes_threshold",
        "signature": "Possible Data Exfiltration - High Outbound Bytes",
        "severity": "high",
        "src_ip": first.src_ip,
        "dst_ip": first.dst_ip,
        "dst_port": first.dst_port,
        "protocol": first.protocol,
        "total_bytes_out": total_bytes,
        "total_gb_out": round(total_bytes / (1024 ** 3), 2),
        "event_count": len(batch),
        "time_window": f"{window_minutes}m",
        "first_seen": first.timestamp.isoformat().replace("+00:00", "Z"),
        "last_seen": last.timestamp.isoformat().replace("+00:00", "Z"),
        "mitre": "T1041,T1048,T1020",
        "recommendation": (
            "Validate destination IP, review endpoint activity, and block or isolate if unauthorized."
        ),
        "source_product": "FortiGate",
        "source_log_type": "traffic-forward",
        "aggregation_key": f"{first.src_ip}|{first.dst_ip}|{first.dst_port}|{first.protocol}",
        "session_ids": [item.session_id for item in batch if item.session_id],
    }


def correlate(events: list[Event], threshold_bytes: int, window_minutes: int) -> list[dict[str, object]]:
    correlator = Correlator(threshold_bytes=threshold_bytes, window_minutes=window_minutes)
    alerts: list[dict[str, object]] = []
    for event in events:
        alert = correlator.process_event(event)
        if alert is not None:
            alerts.append(alert)
    return alerts


def load_state(path: Path) -> ReadState:
    if not path.is_file():
        return ReadState()
    try:
        payload = json.loads(path.read_text(encoding="utf-8"))
    except json.JSONDecodeError:
        return ReadState()
    return ReadState(
        inode=int(payload.get("inode", 0)),
        offset=int(payload.get("offset", 0)),
        initialized=bool(payload.get("initialized", False)),
    )


def save_state(path: Path, state: ReadState) -> None:
    path.parent.mkdir(parents=True, exist_ok=True)
    payload = {
        "inode": state.inode,
        "offset": state.offset,
        "initialized": state.initialized,
    }
    path.write_text(json.dumps(payload, separators=(",", ":")), encoding="utf-8")


def open_from_state(
    input_path: Path,
    state: ReadState,
    start_at_end_on_first_run: bool,
) -> tuple[object, ReadState]:
    handle = input_path.open("r", encoding="utf-8", newline="")
    stat_result = os.fstat(handle.fileno())
    inode = stat_result.st_ino

    if not state.initialized:
        offset = stat_result.st_size if start_at_end_on_first_run else 0
        handle.seek(offset)
        new_state = ReadState(inode=inode, offset=offset, initialized=True)
        return handle, new_state

    if state.inode != inode or state.offset > stat_result.st_size:
        handle.seek(0)
        new_state = ReadState(inode=inode, offset=0, initialized=True)
        return handle, new_state

    handle.seek(state.offset)
    new_state = ReadState(inode=inode, offset=state.offset, initialized=True)
    return handle, new_state


def emit_alert(handle: object, alert: dict[str, object]) -> None:
    handle.write(json.dumps(alert, separators=(",", ":")) + "\n")
    handle.flush()


def run_once(args: argparse.Namespace) -> int:
    input_path = Path(args.input)
    output_path = Path(args.output)

    events = load_events(input_path)
    alerts = correlate(events, args.threshold_bytes, args.window_minutes)

    output_path.parent.mkdir(parents=True, exist_ok=True)
    with output_path.open("w", encoding="utf-8", newline="\n") as handle:
        for alert in alerts:
            emit_alert(handle, alert)

    print(f"Parsed events: {len(events)}")
    print(f"Generated synthetic alerts: {len(alerts)}")
    print(f"Output: {output_path}")
    return 0


def run_follow(args: argparse.Namespace) -> int:
    input_path = Path(args.input)
    output_path = Path(args.output)
    state_path = Path(args.state_file) if args.state_file else output_path.with_suffix(".state.json")

    correlator = Correlator(threshold_bytes=args.threshold_bytes, window_minutes=args.window_minutes)
    state = load_state(state_path)
    output_path.parent.mkdir(parents=True, exist_ok=True)

    loop_count = 0
    with output_path.open("a", encoding="utf-8", newline="\n") as out_handle:
        file_handle, state = open_from_state(input_path, state, args.start_at_end_on_first_run)
        save_state(state_path, state)

        try:
            while True:
                line = file_handle.readline()
                if line:
                    state.offset = file_handle.tell()
                    save_state(state_path, state)

                    raw = line.strip()
                    if not raw or raw.startswith("#"):
                        continue

                    try:
                        event = parse_event(raw)
                    except Exception as exc:  # pragma: no cover
                        print(f"Skipping unparsable line: {exc}", file=sys.stderr)
                        continue
                    if event is None:
                        continue

                    alert = correlator.process_event(event)
                    if alert is not None:
                        emit_alert(out_handle, alert)
                        print(
                            "Generated synthetic alert for "
                            f"{alert['aggregation_key']} with {alert['total_bytes_out']} bytes"
                        )
                    continue

                time.sleep(args.poll_interval)
                loop_count += 1
                if args.max_loops and loop_count >= args.max_loops:
                    break

                current_stat = input_path.stat()
                if current_stat.st_ino != state.inode or current_stat.st_size < state.offset:
                    file_handle.close()
                    file_handle, state = open_from_state(input_path, state, False)
                    save_state(state_path, state)
        finally:
            file_handle.close()

    print(f"State: {state_path}")
    print(f"Output: {output_path}")
    return 0


def main() -> int:
    args = parse_args()
    if args.mode == "follow":
        return run_follow(args)
    return run_once(args)


if __name__ == "__main__":
    raise SystemExit(main())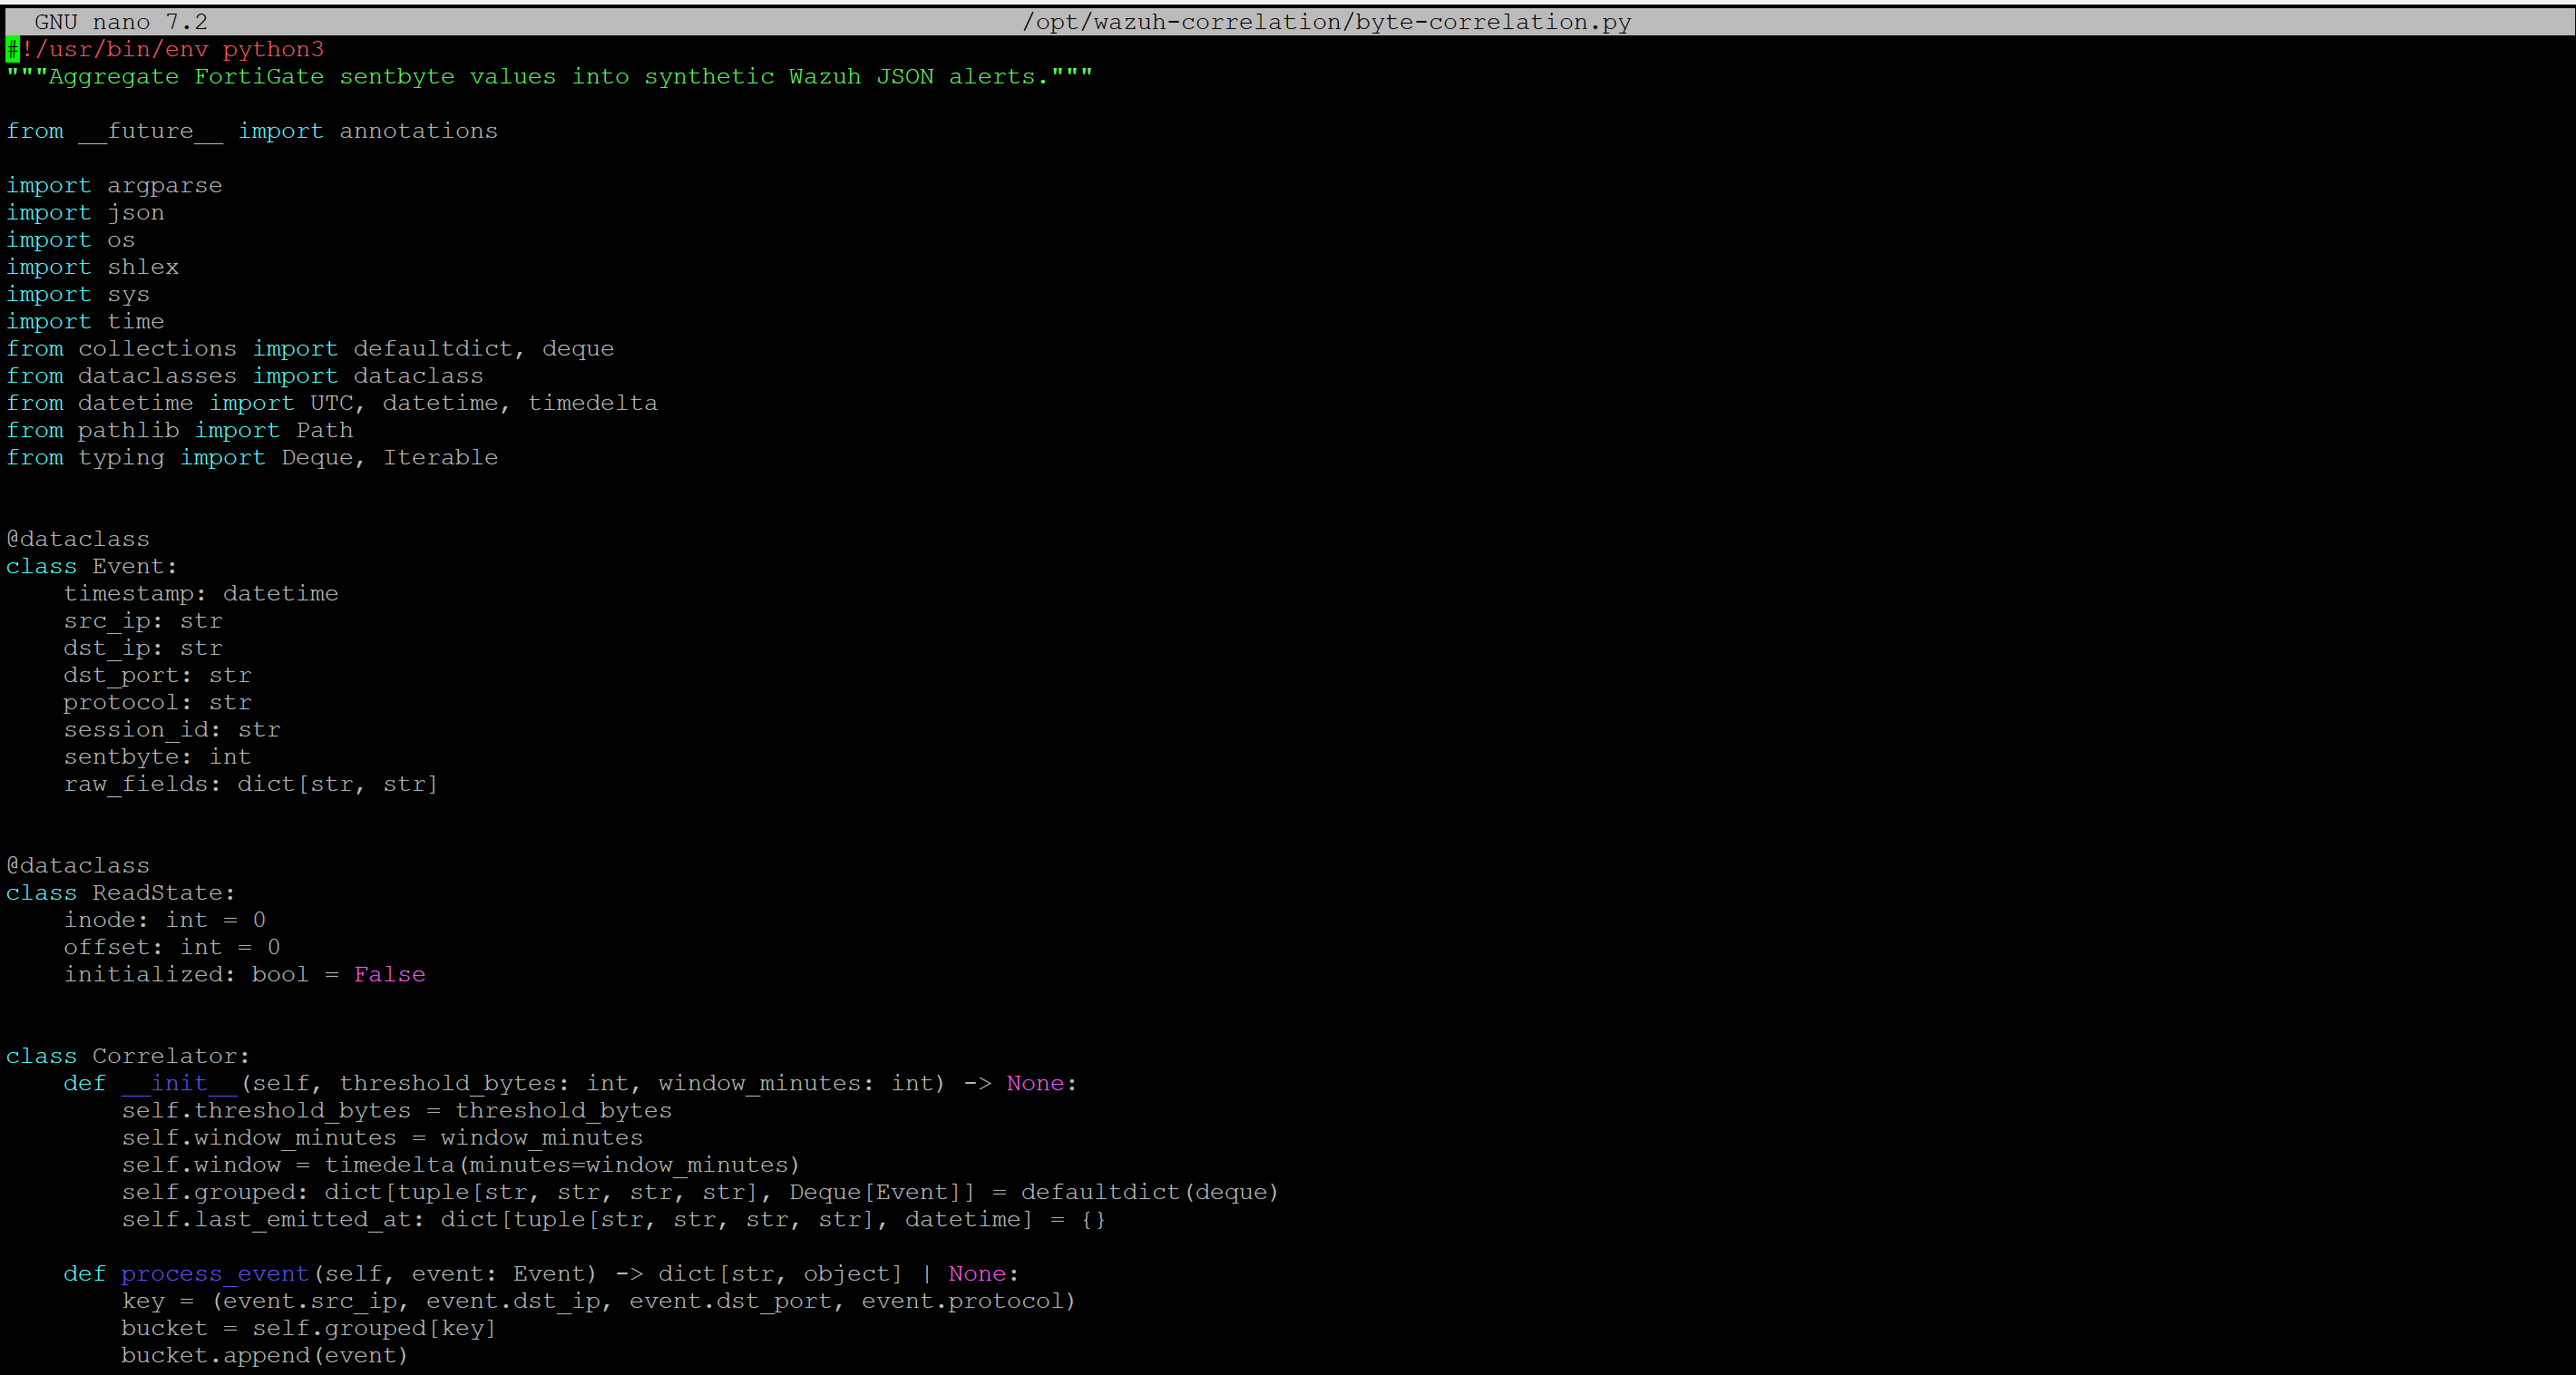
Make it executable:
sudo chmod +x /opt/wazuh-correlation/byte-correlation.pyStep 10: Create the service environment file
Create:
sudo nano /etc/default/fortigate-byte-correlationAdd:
INPUT_LOG=/var/log/fortigate.log
OUTPUT_LOG=/var/log/wazuh-correlation/data_exfil.json
STATE_FILE=/var/lib/wazuh-correlation/fortigate-byte-correlation.state.json
THRESHOLD_BYTES=10737418240
WINDOW_MINUTES=15
POLL_INTERVAL=2
START_AT_END_FLAG=--start-at-end-on-first-run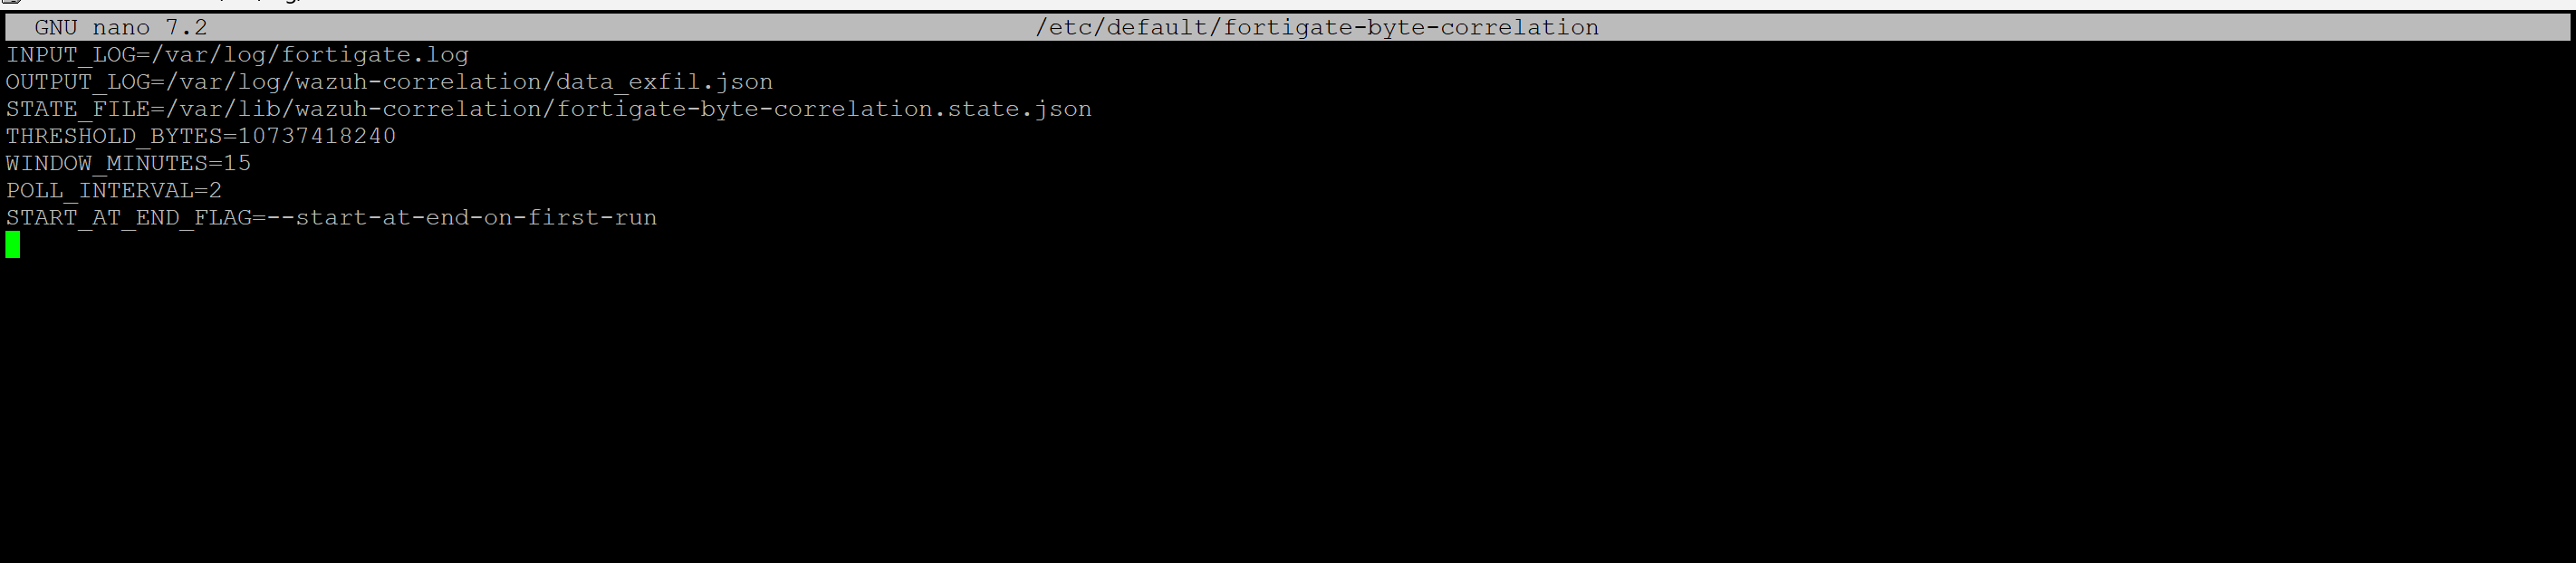
What does the threshold mean?
10737418240 bytes = 10 GiB
You can tune this based on your environment.
Step 11: Create the systemd service
Create:
sudo nano /etc/systemd/system/fortigate-byte-correlation.serviceAdd:
[Unit]
Description=FortiGate byte correlation for Wazuh synthetic exfil alerts
After=network-online.target
Wants=network-online.target

[Service]
Type=simple
User=root
Group=wazuh
EnvironmentFile=/etc/default/fortigate-byte-correlation
ExecStart=/usr/bin/python3 /opt/wazuh-correlation/byte-correlation.py \
  --mode follow \
  --input ${INPUT_LOG} \
  --output ${OUTPUT_LOG} \
  --state-file ${STATE_FILE} \
  --threshold-bytes ${THRESHOLD_BYTES} \
  --window-minutes ${WINDOW_MINUTES} \
  --poll-interval ${POLL_INTERVAL} \
  ${START_AT_END_FLAG}
Restart=always
RestartSec=5
NoNewPrivileges=true
PrivateTmp=true
ProtectSystem=full
ReadWritePaths=/var/log/fortigate.log /var/log/wazuh-correlation /var/lib/wazuh-correlation

[Install]
WantedBy=multi-user.target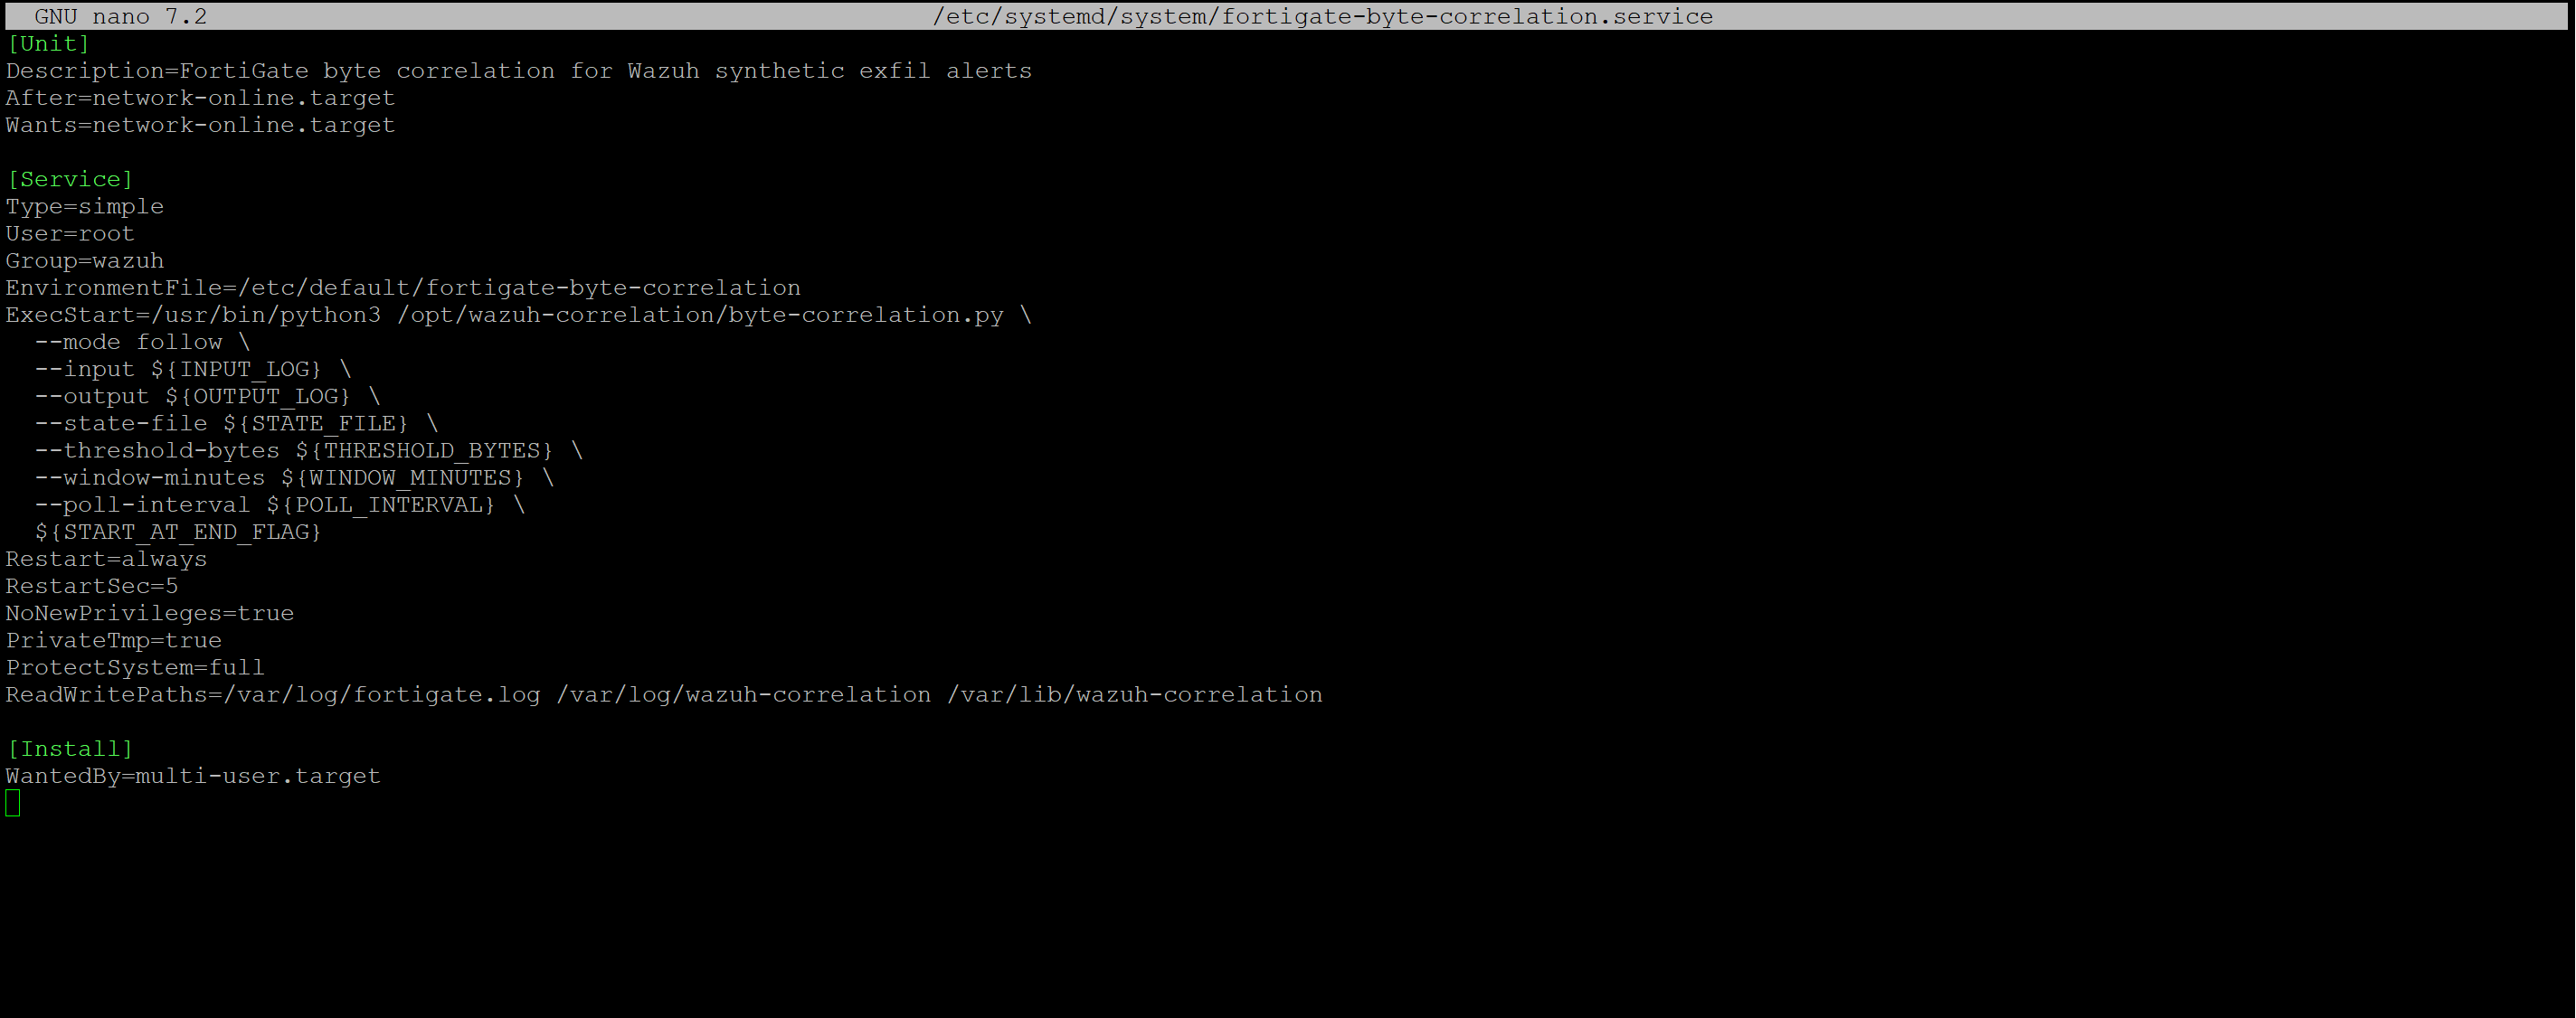
Enable and start it:
sudo systemctl daemon-reload
sudo systemctl enable --now fortigate-byte-correlation
sudo systemctl status fortigate-byte-correlation
Step 12: Restart Wazuh
After updating localfiles and rules, restart Wazuh:
sudo systemctl restart wazuh-manager
sudo systemctl status wazuh-manager
If you are using a separate Linux collector with a Wazuh agent:
- restart the agent after changing the agent ossec.conf
- restart the manager after changing manager-side rules
Step 13: Test the raw FortiGate alert
Use wazuh-logtest to validate the raw FortiGate event path.
Run:
sudo /var/ossec/bin/wazuh-logtestPaste the raw FortiGate sample log from Step 3.
Expected raw result
Rule id: 110520
Level: 3
Description: FortiGate raw traffic event with outbound byte count recorded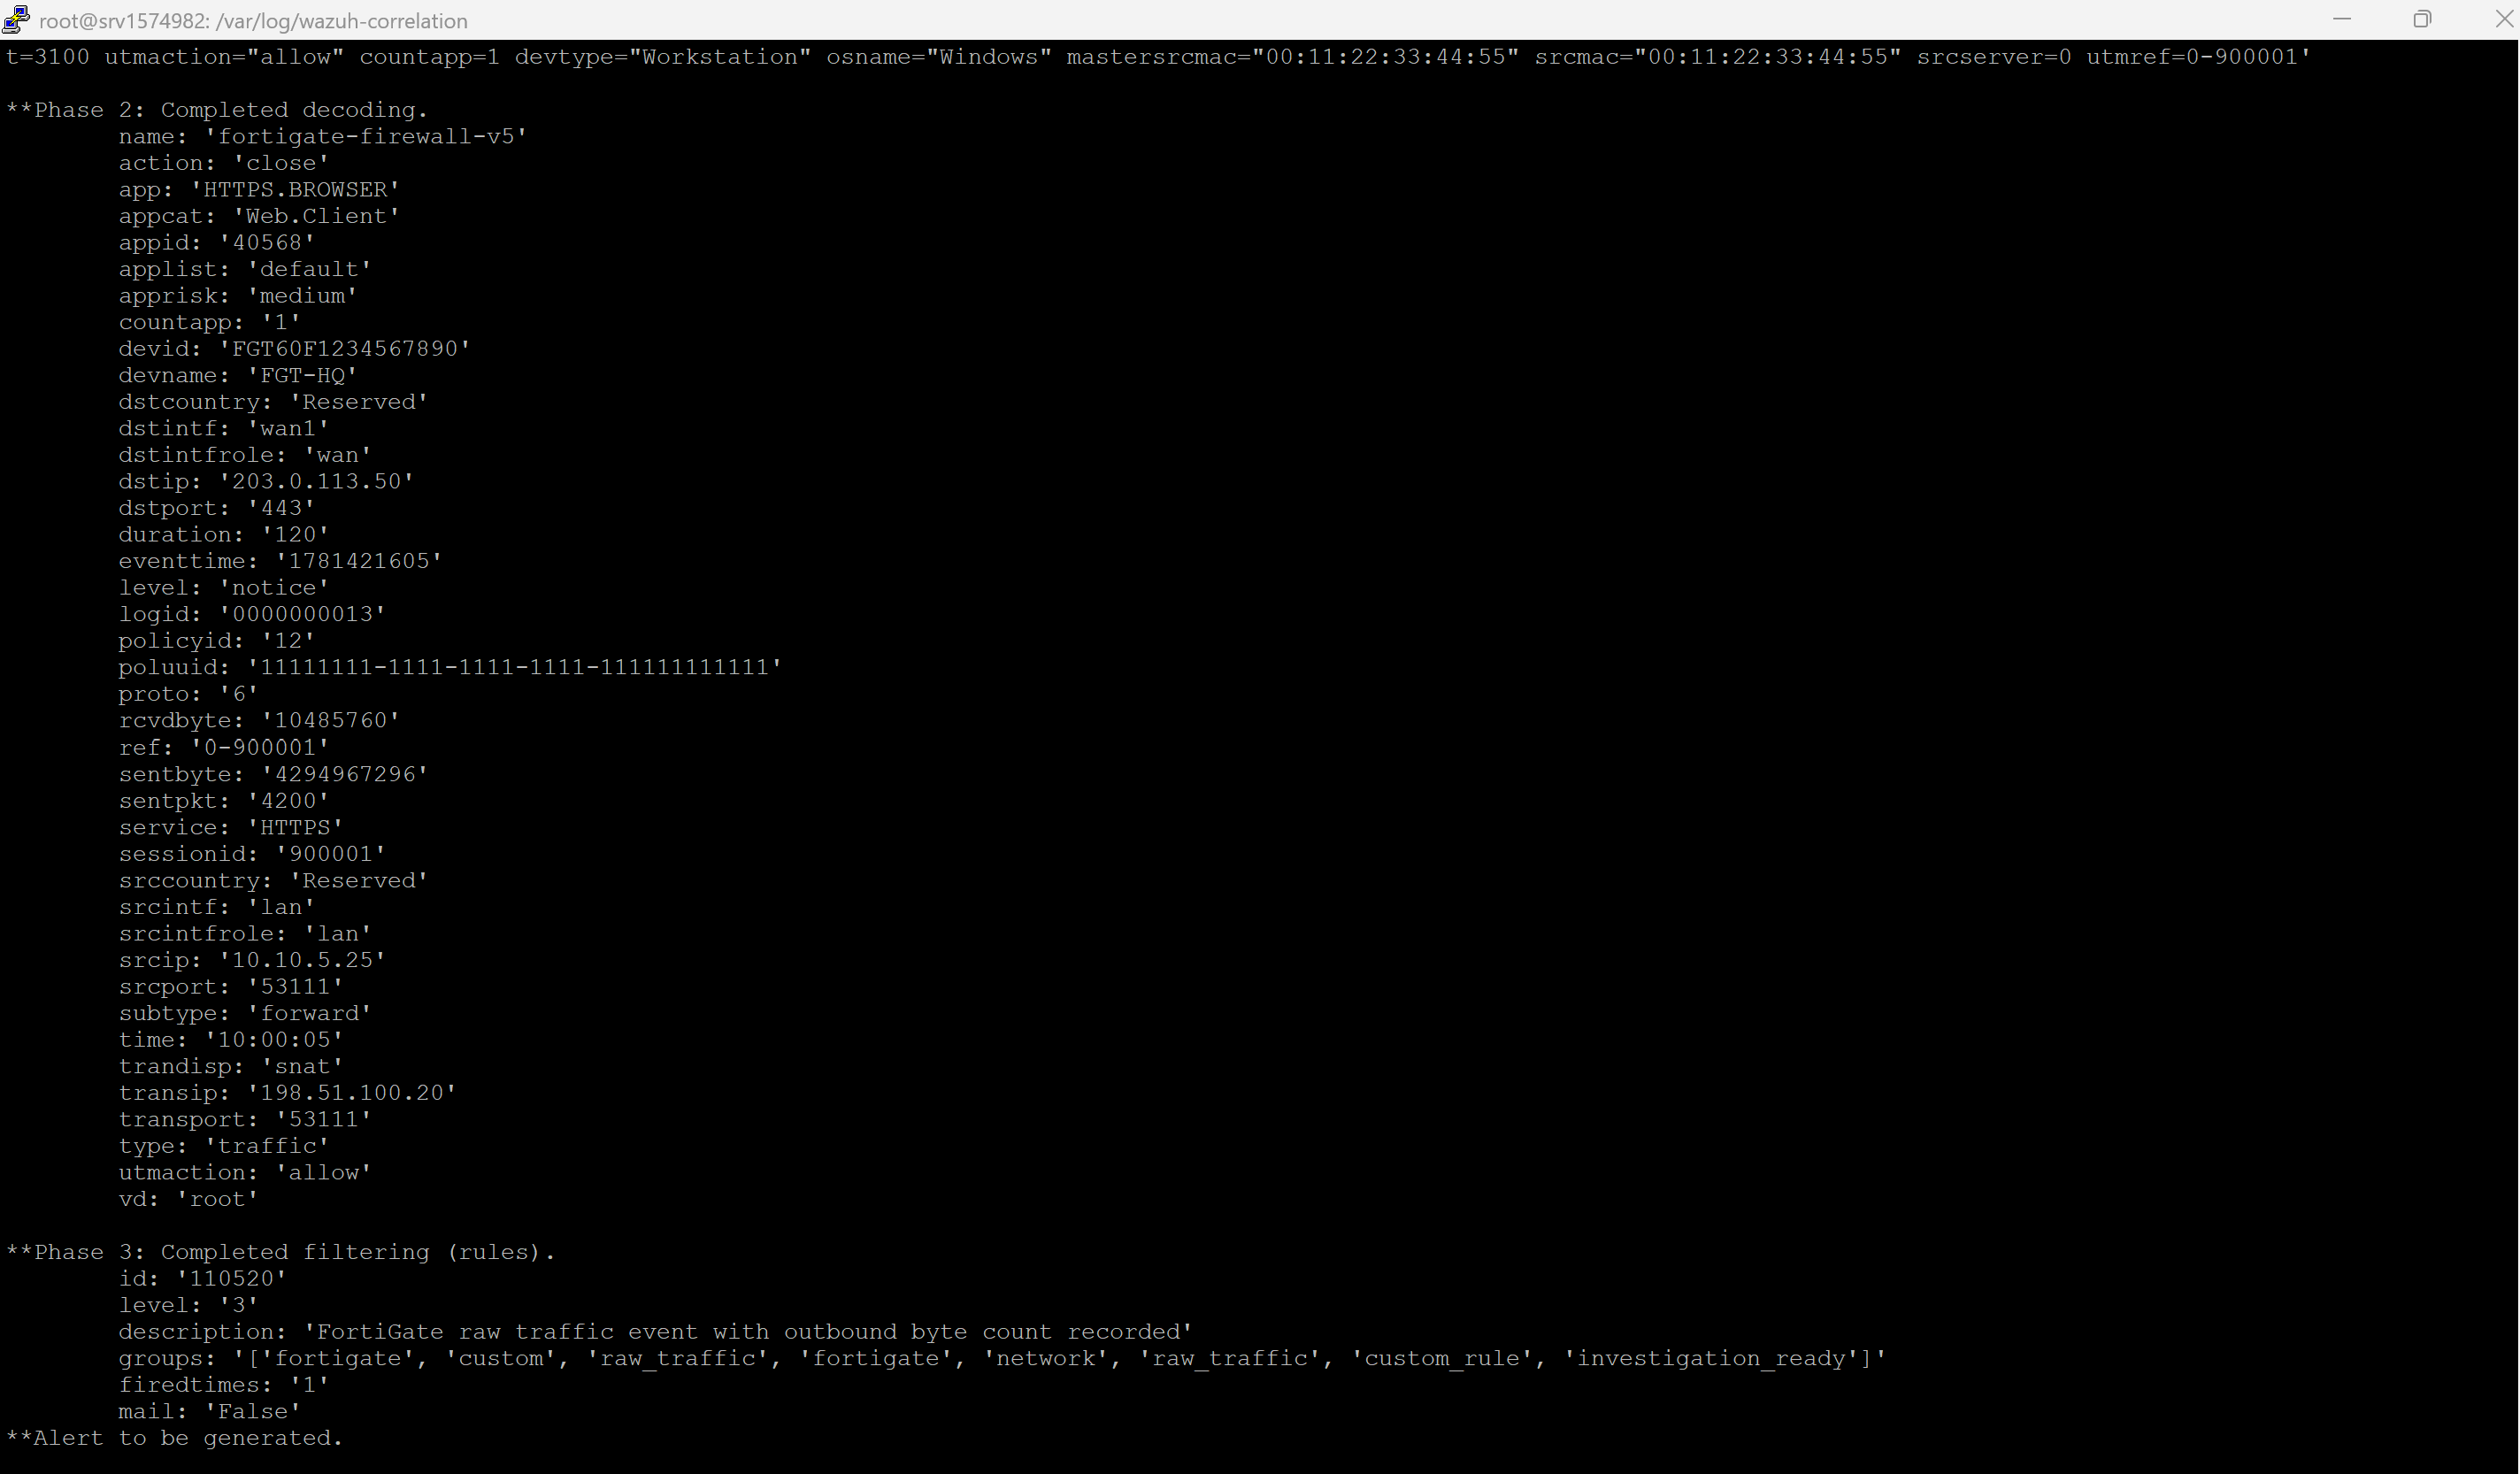
Then monitor live alerts:
sudo tail -f /var/ossec/logs/alerts/alerts.jsonYou should now see the raw FortiGate alert in alerts.json.
Step 14: Test the final synthetic correlation alert
You can also validate the synthetic JSON alert with wazuh-logtest.
Paste this JSON:
{"correlation_type":"data_exfiltration_bytes_threshold","signature":"Possible Data Exfiltration - High Outbound Bytes","severity":"high","src_ip":"10.10.5.25","dst_ip":"203.0.113.50","dst_port":"443","protocol":"TCP","total_bytes_out":12884901888,"total_gb_out":12,"event_count":3,"time_window":"15m","first_seen":"2026-06-15T00:05:05Z","last_seen":"2026-06-14T10:00:05Z","mitre":"T1041,T1048,T1020","recommendation":"Validate destination IP, review endpoint activity, and block or isolate if unauthorized.","source_product":"FortiGate","source_log_type":"traffic-forward","aggregation_key":"10.10.5.25|203.0.113.50|443|TCP","session_ids":["900201","900001","900001"]}Expected final correlation result
Rule id: 110510
Level: 12
Description: Possible Data Exfiltration: Suspiciously large outbound data transfer detected within 15 minutes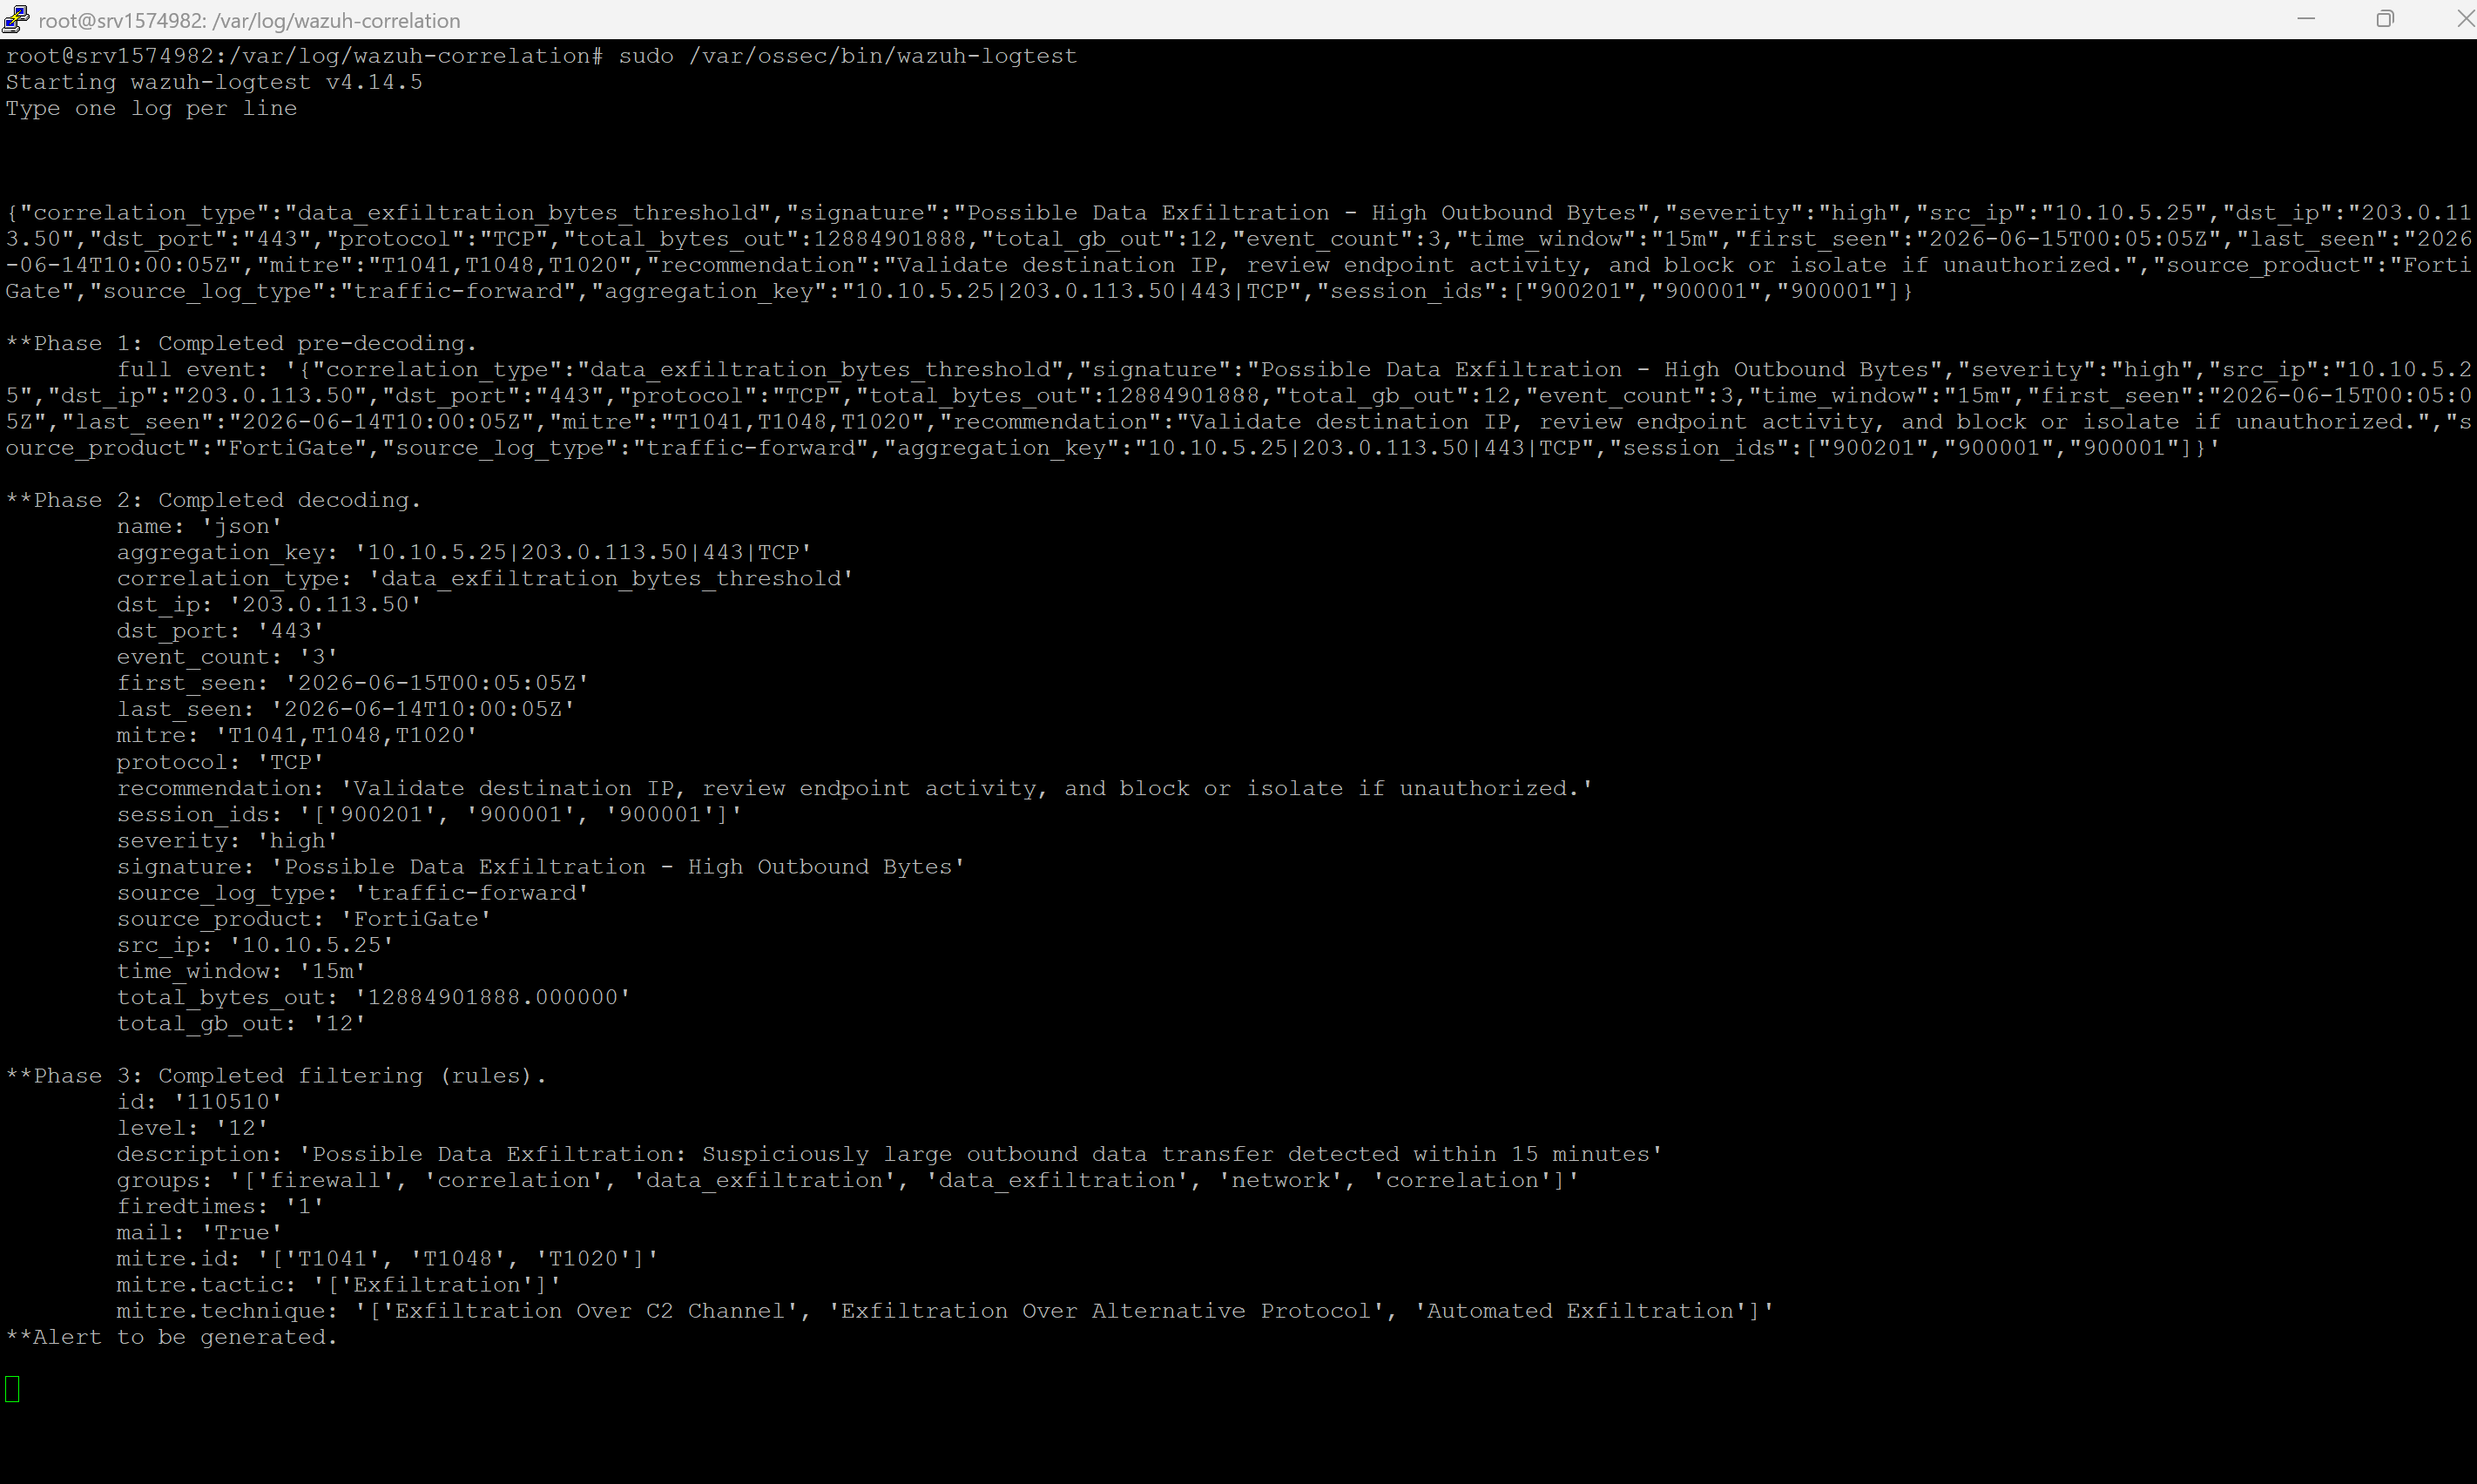
If the pipeline is working end to end, that synthetic event should also appear in:
/var/ossec/logs/alerts/alerts.jsonStep 15: What your final state should look like
At this point, your environment should produce two useful alert layers:
- Rule 110520: raw FortiGate traffic alert for investigation
- Rule 110510: final high-confidence correlation alert for exfiltration triage
This is the main benefit of the design:
Raw FortiGate event stays available for analyst investigation
Correlation script handles sentbyte math
Wazuh still creates the final official alert
SOAR only needs the correlated alert if you want to keep triage noise low
Optional: Separate Linux collector with Wazuh agent
If FortiGate logs land on another Linux server, this is still a valid and often cleaner architecture.
Flow
FortiGate
  -> Linux collector
  -> /var/log/fortigate.log
  -> byte-correlation.py
  -> /var/log/wazuh-correlation/data_exfil.json
  -> Wazuh agent localfile entries
  -> Wazuh manager
  -> rules and alerts.json
Agent-side localfile config
Add both of these to the collector agent’s /var/ossec/etc/ossec.conf:
<localfile>
  <log_format>syslog</log_format>
  <location>/var/log/fortigate.log</location>
</localfile>

<localfile>
  <log_format>json</log_format>
  <location>/var/log/wazuh-correlation/data_exfil.json</location>
</localfile>
Important difference in this pattern
In this design:
- the collector receives FortiGate syslog
- the collector runs byte-correlation.py
- the collector Wazuh agent forwards raw and synthetic logs
- the manager keeps the custom rules and generates the final alerts
Troubleshooting
Raw log arrives, but no alert is created
- test the raw FortiGate line in wazuh-logtest
- confirm Wazuh matches the built-in FortiGate traffic rule first
- check that your custom rule file is loaded under etc/rules
Synthetic JSON is written, but no final alert appears
- confirm log_format is json
- test one JSON line with wazuh-logtest
- confirm the rule matches correlationtype=dataexfiltrationbytesthreshold
Custom rule file exists but Wazuh ignores it
- restart wazuh-manager
- confirm your custom rule directory is loaded
- confirm the XML syntax is valid
Too many repeated alerts
- raise the threshold
- increase the time window
- extend duplicate suppression logic in byte-correlation.py
Nothing is written to the synthetic file
- check:
sudo systemctl status fortigate-byte-correlation- confirm the environment file paths are correct
- confirm the script can read /var/log/fortigate.log
Separate collector deployment does not work
Remember:
- manager-local localfile entries are not needed for logs already forwarded by the Wazuh agent
- raw and synthetic log localfiles should be on the collector agent
- custom rules stay on the manager
Conclusion
This correlation pattern gives you a practical way to detect large outbound FortiGate transfers without forcing Wazuh rules to do arithmetic they were not designed to do.
The final model is clean:
FortiGate provides the raw evidence
Python handles the byte aggregation
Wazuh creates the final official alert